AKS Latency and performance/availability issues due to IO saturation and throttling under load #1373
Comments
|
Would using ephemeral OS disks #1370 alleviate this? when the current default nodepool is
if moving the docker-root with knode
with ephemeral
(ephemeral IOPS numbers plucked from) |
|
@djeeg not exactly. The iops are still capped - for example the same effect is met if you use a 2tb regular blob disk. All you do by moving it is expand your ceiling until the failure occurs. This is why we are adding metrics/monitoring/alerting and we recommend customers do the same in addition to isolating data paths for things like Docker IO and container logging off of the single IO path, ephemeral or not. The container/kube stack doesn’t have hard guarantees around these resources, so the failures when they occur look like something else entirely AKS is moving to ephemeral OS disks, and as I noted making other changes to make this clear, obvious and consistent in behavior |
|
Can you confirm that this statement is correct "Assuming I wanted four devices on my VM, each device would have a maximum IOPS of 3200 (12800*4) or a single device with a maximum IOPS value of 12800." If I had a DS3v2 with 3x P10 disks and 1x P40 disk, I would expect the P40 to perform up to its IOPS limit of 7500 IOPS. |
|
@Ginginho there are multiple quotas in play here. If you have 4 drives it doesn’t matter what their individual quota is (you’re right if you slam the p40 disk it will max for that device). But! If you saturate the p40 and not the other drives to the VM sku IOPS limit, you’ll hit the p40 limit first, the the VM iops limit. You can do both. So yes, a p40 will max at 7500 iops max. So you have to remove 7500 iops from the total quota for all devices on the VM |
|
You can not have 4 devices or a single device attached to a VM that exceeds the iops quota for the VM sku, then you need to account for the limit per drive |
|
I have a couple of clarifications I would like to check:
Could you clarify that? As I understand it, in Linux sockets are modelled like a file but do not actually operate as files. In other words, even if I create local sockets, the data is transferred across memory and does not involve physical disk I/O. It's important to clarify that, because if we think socket operations involve disk I/O and you have a very socket-based service in a container (such as a high throughput Web server that doesn't reuse sockets well) then there would be a direct correlation between your throughput and your choice of disk IOPS. And I believe that shouldn't be the case, but am happy to be proven wrong.
Should that be 12800 / 4? Thank you for such a detailed write-up, it is very helpful. |
|
@asos-andrewpotts everything is modeled after a file - Eg sockets live on the fs and the data path is offloaded by the kernel for that device (not in all cases, samba/cifs kernel modules can be single threaded) from the primary data path but the socket. If a service can not open, stat() or otherwise read it’s socket the system is still dead and throttled. This is why if IO doesn’t abate the hosts will kernel panic. You won’t see the data path (actual bytes to the store) count against things but you will see the socket open/close/read/write all count against you and fail. This is a gotcha running Linux hot/under load And that’s not a typo - I meant 4x devices, but ordering is hard |
|
@jnoller - OK, I get it. So open(), stat() etc, will be counted against the Azure Storage Max IOPS, even though the socket send and receive don't persist to disk. And if the Max IOPS is exceeded then those operations will fail resulting in your container app being unable to make an outbound API call, or service a new incoming socket. Thank you! |
|
@asos-andrewpotts Yes, but - This is true for all Linux disk devices regardless of cloud / vendor - open, close, stat, etc on the socket will trigger IO operations (IOPS). Yes, in this example - it is one source of the total IO which is why the Docker container IO can 'starve' the socket files on the OS disk - once the IOPS peak is hit, all file calls to /dev/sda including writing the disk journal can time out. Your example of this causing the API call to fail is precisely correct, but networking itself isn't a large driver of IO Possible IO sources on the root disk are the kernel, system logging, sockets on disk, docker / container / daemon IO paths, single threaded network attached disk or other kernel drivers, spikes in overall system load causing all of those (eg failover) to hit at once. |
|
I didn't find the IOPS for the temporary disk on any official documentation. Is it the same of the OS disk? |
|
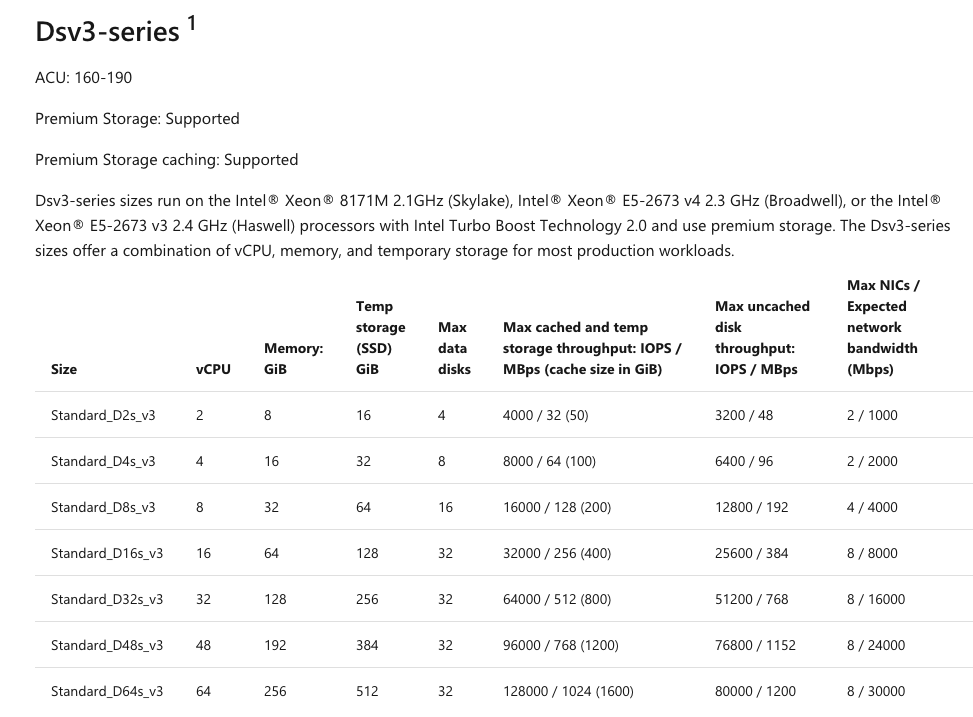
@edernucci So temp disk IOPS are special (and actually pretty great because ephemeral) "it depends" - and its really not clear: On most charts, you want to look at "Max cached and temp storage throughput: IOPS / MBps (cache size in GiB)" Here's a screenie
https://docs.microsoft.com/en-us/azure/azure-resource-manager/management/azure-subscription-service-limits#virtual-machine-disk-limits - good read |
|
@edernucci But, this answers a secondary question: why not just use ephemeral OS disks? Ephemeral disks are limited to the max IOPS above and cache size. So, different limit, a lot higher - but its still going to be exhausted. https://docs.microsoft.com/en-us/azure/virtual-machines/windows/ephemeral-os-disks#size-requirements |
|
@jnoller My production cluster has 100GB SSD for OS (500 IOPS limited) on F8s (v1) machines. Looking on that table I got 32000/256 (96) on Max cached and temp storage throughput: IOPS / MBps. If I correctly understood, I can really get a lot more IOPS (something near the 32000 versus my actual 500) just by moving my docker temp files to temp disk. Is this statement right? Regards, |
|
@edernucci That's correct |
|
what is meaning of "cache size in GiB" in "Max cached and temp storage throughput: IOPS / MBps (cache size in GiB)"? |
|
@infa-ddeore cache size in gigabytes of the virtual machine (each machine type has different cache sizes). IOPs is as the main article states - IO operations per second. IOPs are all file open, read, write, close and so on. Mbps is megabytes (or bits, I may be swapping them) per second- megabytes or megabits per second is a definition of bandwidth, so if a hard drive has a size of two terabytes, it will also have a maximum number of IOPs it can support as well as a max on how much data you can read or write per second. So what that means is (peak file operations) / (peak storage bandwidth) with cache size in gigabytes being the cache size for the VM sku |
|
I’d put money on you still being throttled at the OS disk; any os path latency above a few milliseconds will cause additional timeouts, however I know @andyzhangx is debugging other pvc latency |
|
From https://stian.tech/disk-performance-on-aks-part-1/#Test1
Is there a way to disable caching (or setting it to read-only) for the AKS node OS disks? |


|
No @0x53A and disabling caching on any type of IaaS NAS (network attached storage) can lead to data loss and other worse performance issues. The blog post you linked looks to have missed the NAS issues and the IOPS quota limits that would trigger the issues around latency. |
|
The Microsoft documentation linked seems to suggest disabling it for write-heavy disks, which the node os disk probably is. |
|
@0x53A Removing the cache layer is not an optimization / solution for this - it will still be exhausted at the IOPS level, no matter what or how you layout your disks. More importantly, the tests linked completely omit the fact your atomic file operations when hit with the throttle can push disk latency into the 1000+ms range - and with uncached IO that is a lot harder and faster, and more data loss causing failure. |
|
@0x53A I took a bit more time to break down (and commit to re-testing and clarifying) that blog post here: https://github.com/jnoller/kubernaughty/issues/46 Specifically, the author missed the primary bottleneck - the OS disk of the VM itself. When you have chatty containers, logging, etc that is all slamming into the OS disk. That trips the throttle - and will with any disk size, it's just time * scale - if you look at his graphs, you'll notice a weird almost heartbeat like bounced in the latency - that is consistent with the underlying OS disk being choked.
I'm working on more testing and analysis - one of those tests is data path isolation, running each test to isolate the precise pattern and therefore the remediation is time consuming. Here are some errors you may find in your logs - including API server / tunnelfront errors:
|


|
Couldn't an earlier backpressure still help to mitigate symptoms? For example let's take image pull - with the write cache enabled, it will download as fast as it can and write to the azure cache until it is full. Then the whole node is blocked while the cache flushes. Without the write cache, I would guess that it hits the IOPS limit faster and is throttled, but the kernel can then interleave other IO while pulling and the node is not completely blocked, even if the latency increases. The total read/write speed is probably slower without the cache, but it's okay if pulling takes a bit more time if the whole system stays responsive. This reminds me a little of an article I read a few years ago about too big TCP buffers in routers causing issues (hashtag Bufferbloat), but I'm by no means an expert. The major trigger for me was adding deployments, I was able to (hopefully) mitigate that by running them in sequence instead of parallel: pulumi/pulumi-kubernetes#986 Thank you for all your work! |
|
@0x53A No problem! The issue with optimizing that path that way (removing the cache) is the sheer performance penalty you'd see (these are NAS devices after all), then there's the risk of data loss - finally, there's the issue that having disk latency as high as this causing total node failure which is unacceptable. I'm trying to work towards testing the caching mode, but right now I recommend moving the docker data directory to the temp ephemeral disk (you don't need image caching, it's that fast) to isolate the worst data path offender, after that it's going to be isolating the others (logging, security software) to dedicated data paths so that user workloads can not sink the system. And yep, deployments cause a spike in container downloads and then start times, you'll see extremely high container operation latency in the kubelet reports that correlate to the time of the kube apply |
|
When we apply knode to the cluster omsagent stop shipping logs. This is because omsagent has volume mount for container logs set to |
|
@gsimoes Because of the volume mount, I have not (personally) adapted omsagent to the new paths yet |
|
@jnoller this is only circumstancial evidence so far, but for me setting the Azure Cache to Read-Only seems to have improved things massively. I have two nodes, 1 with the default settings, and one where I went into the VMSS settings and changed the settings manually.
On Node#0 (default settings) all pods are failing with Back-off restarting failed container, and CPU is maxed out.
On Node#1 (ReadOnly), everything is green and CPU went down to a stable state after some time.
(Here I am using CPU usage as an indicator of the system being "stable") I'll re-deploy my node-pools with all nodes set to ReadOnly and monitor it for a bit. |


|
@0x53A yes, disabling the cache will improve things but at the cost of data coherency and worse. And cpu utilization is not an indicator of this issue. (Edited to reflect: shutting off the cache helps performance overall and makes the read write behavior much more consistent. The trade off is the performance of the disk is ‘lowered’ to the pre-cache performance limit) |
|
@jnoller I suggest trying this patch [1] out to fix the kubepods.slice cgroup memory limit. In Openshift, we found that the kubepods.slice is being set to [max memory] on a node, instead of [allocatable]-[reservations]. When a node is under memory pressure (with max memory), the kernel can page out file and executable caches, causing the kernel to pause in iops waits trying to re-read it's cache. The pods won't get evicted in this scenario, or will take a very long time. (I saw kernel pauses upwards of 30 minutes). In the fixed scenario, the kubepods.slice memory reservation allows the kernel to have enough room to perform the OOM or allow the kubelet to evict the pod. Make sure to set the kubelet --system-reserved (memory) to a reasonable value! Patch [2] is sorta in the same area of the code, but we have not tried it out. I am extremely curious to know if this [1] patch improves your tests. |
|
@rphillips Ooooo - interesting thank you for this, I want to try this out for sure!! This explains some crazy kube-reserved issues we've seen with memory-constrained/saturated loads. In this case, I know that the workloads aren't under memory pressure - the memory pressure comes after the system shifts into IOWait - looking at the patches they only cover the IO constrained failure mode, this (my) issue includes a memory spike and growth over time but it is due to the IOPS / throttle / quota behavior causing IOWaits like this:
I really want to test java/jvm based workloads with this patch - those are usually the ones hitting the OOMKiller and other crazy memory consumption scenarios. |

|
@juan-lee @alexeldeib ^ take a peek at that patch |
|
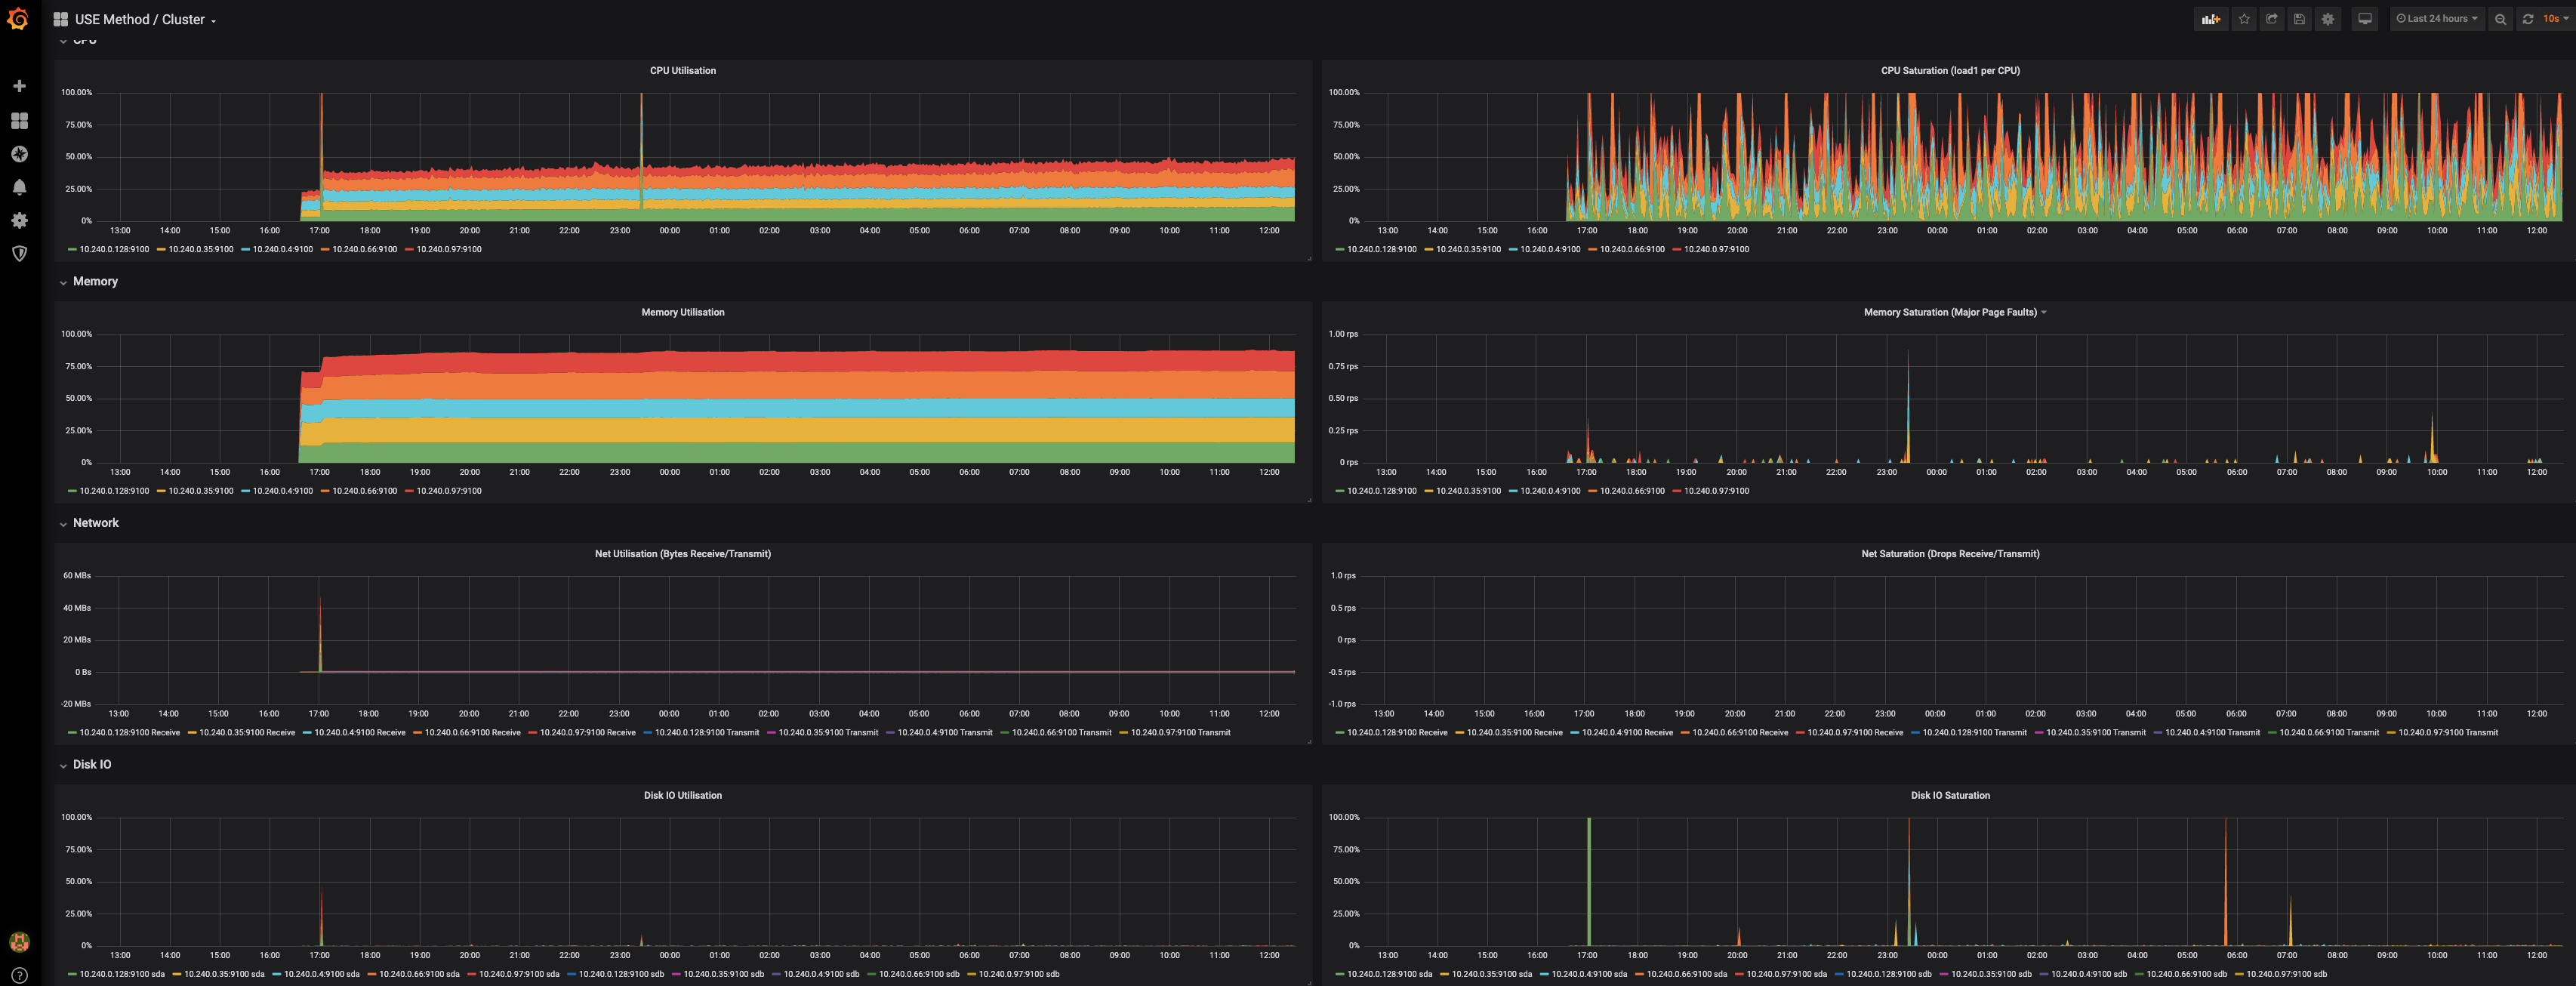
@jnoller Do you have any net saturation data? The following image does not have any data.
|
|
@rphillips ?? It does, look to the left. The workload is a simulation of a ML workload so it’s not network constrained, it’s IO |
|
Ah hah! Thanks. |
|
@0x53A I was wrong (hopefully, I want to test and re-check), it looks like shutting of the cache help the performance (as a whole). It doesn’t solve the iops issue - your test shows that, but it helps a lot, the earlier backpressure reduces the total load allowing it to recover more easily. Honestly I had forgotten shutting the write cache off in general was a good idea. It will “lower” the disk performance to the real uncached performance, but that’s for stability, it’s going to be more consistent overall so that would be a fair trade off I’m not sure about failure scenarios but I think since we’re dealing with journaled filesystems we’re ok there. Cc @juan-lee |
|
@jnoller Is the |
|
@rphillips Yeah, these are all stock builds: Interested to test this as well (let me know what your tests find) - there's also a missing bundle of sysctl tunables that could help. I do worry about the line between 'optimizing the behavior and performance' vs the key IOPS exhaustion and stack failures above that, swapping the scheduler seems like optimization though. Time to test! |
|
Posting from our investigations within the AKS product team as this issue still gets attention. We have confirmed that high IO latencies (IO that takes more than 1 second) breaks kubelet, containerd and CoreDNS operations. You will see "context deadline... reached" in the logs when that happens. You can also confirm your IO latencies by running " We recommend customers move to Ephemeral OS disks for production workloads. It is currently the default disk type in AKS for the latest API versions. For existing AKS clusters, you can create a new nodepool with Ephemeral OS disk. The reason behind high IO latencies for Azure managed disks are two fold: 1) There was a known issue with managed disks in which high amount of write operations may cause subsequent IO stalls. This issue was mostly fixed in an Azure Disks release in March 2021. 2) Provisioned disk have limited IO and bandwidth and if you go over it, you will start seeing throttling which will surface up as high IO latencies. |
edit: Please contact Azure support to assess if you are impacted.
Issue summary
AKS Engineering has identified an issue leading to customers reporting service, workload and networking instability when running under load or with large numbers of ephemeral, periodic events (jobs). These failures (covered below) are the result of Disk IO saturation and throttling at the file operation (IOPS) level.
Worker node VMs running customer workloads are regularly disk IO throttled/saturated on all VM operating system disks due to the underlying quota of the storage device potentially leading to cluster and workload failure.
This issue should be investigated (as documented below) if you are seeing worker node/workload or API server unavailability. This issue can lead to NodeNotReady and loss of cluster availability in extreme cases.
Contents:
* Common errors seen in logsCustomers may jump ahead to common errors and mitigation, we recommend not doing so as this issue is a common IaaS pitfall.
Issue Description
Most cloud providers, Azure included, use storage supplied by Azure Disks for the Operating system / local storage for a given Virtual Machine by default for many VM classes.
Physical storage devices have limitations in terms of bandwidth and total number of file operations (IOPS) but this is usually constrained by the physical device itself. Cloud provisioned block and file storage devices also have limitations due to architecture or service limits (quotas).
These service limits/quotas enforced are layered – including VM, network cards, disks specific quotas, etc. When these limits are exceeded the service itself (storage, compute, etc) pushes back (throttles) the offending entity.’
Examining the customer reported failures, AKS engineering identified that customer workloads were exceeding quotas set by Azure Storage to the operating system disk of cluster worker nodes (Max IOPS). Due to the nature of the failure customers would not be aware to monitor for these metrics on worker nodes.
AKS has identified this issue as contributing significantly to the following common error / failure reports:
removed
The root-cause of this issue is resource starvation / saturation on the worker nodes. The trigger of the failures is IO overload of the worker node OS disks. This leads to the OS disk (from the perspective of the kernel) becoming unresponsive, blocked in IOWait. As everything on Linux is a file (including network sockets) - CNI, Docker, and other services that network I/O will also fail as they are unable to read off of the disk.
For linux system engineers - if you strace() the processes you will see them locked in fsync, fwait, lock acquisition (pthread) and other operations.
The events that can trigger this throttle include high volumes of Docker containers running on the nodes (Docker IO is shared on the OS disk), custom or 3rd party tools (security, monitoring, logging) running on the OS disk, node failover events and periodic jobs. As load increases or the pods are scaled, this throttling occurs more frequently until all nodes go NotReady while the IO completes/backs off.
Key take aways:
Quotas leading to failure
When an AKS cluster is provisioned the worker nodes VMs are all assigned 100 GiB operating system disks. For this example, we will use a DS3_v2 SKU - per the documentation this SKU has the following limits:
The Max IOPS value shown here is the total for the VM shared across all storage devices. For example, this sku has a maximum of 12800 IOPS. Assuming I wanted four devices on my VM, each device would have a maximum IOPS of 3200 (12800 / 4) or a single device with a maximum IOPS value of 12800.
Azure, using network attached storage maps these to specific disk classes / types - AKS defaults to use Premium SSD disks. Additionally, these disks are mounted to the Linux host as Samba/CIFS volumes. If we look at the storage quotas/limits we see:
AKS uses 100 GiB OS disks for worker nodes by default - in the chart above, this is a P10 tier disk with a Max IOPS value of 500.
This means, using our example DS3_v2 SKU (VM Max IOPS 12800) has an OS disk Max IOPS of 500 (P10 Class Max IOPS 500). Your application - or rather, the software running within the Virtual Machine can not exceed these values - doing so will result in host throttling.
When quotas are stacked with VM, networking and storage, the lesser of the quotas applies first, meaning if your VM has a maximum IOPS of 12800, and the OS disk has 500, the maximum VM OS disk IOPS is 500, exceeding this will result in throttling of the VM and it's storage until the load backs off.
These periods of throttling of the VM due to the mismatched IaaS resources (VM/Disk vs workload) directly impacts the runtime stability and performance of your AKS clusters.
For more reading on Azure / VM and storage quotas, see "Azure VM storage performance and throttling demystified".
Note: These limits and quotas can not be expanded or extended for any specific storage device or VM.
Issue Identification
AKS engineering is working on deploying fleet wide analysis and metrics collection for these failures and issues, including enhancements to Azure Container Insights and other tools and utilities for customers and other product changes.
While those are in progress the following instructions will help customers identify these failures and other performance bottlenecks in their clusters.
Metrics / Monitoring Data
AKS recommends customers add monitoring / telemetry for the Utilization Saturation and Errors (USE) method metrics in addition to the recommended SRE "Golden Signals" for all workers/nodes/etc.
The USE method metrics are a critical component as many customer applications run both a mixture of application services and back end services. The USE metrics specifically help you identify bottlenecks at the system level which will impact the runtime of both.
For more information on the metrics/signals see:
Additionally, for a good look at the USE metric(s) and performance testing AKS specifically, see: "Disk performance on Azure Kubernetes Service (AKS) - Part 1: Benchmarking".
Identification using the prometheus operator (recommended)
The prometheus operator project provides a best practice set of monitoring and metrics for Kubernetes that covers all of the metrics above and more.
We recommend the operator as it provides both a simple (helm) based installation as well as all of the prometheus monitoring, grafana charts, configuration and default metrics critical to understanding performance, latency and stability issues such as this.
Additionally the prometheus operator deployment is specifically designed to be highly available - this helps significantly in availability scenarios that could risk missing metrics due to container/cluster outages.
Customers are encouraged to examine and implement using their own metrics/monitoring pipeline copying the the USE (Utilization and Saturation) metrics/dashboard, as well as the pod-level and namespace node level utilization reports from the operator. Additionally the node reports clearly display OS disk saturation leading to high levels of system latency and degraded application/cluster performance.
Installation
Please Note: Installation of the Prometheus Operator requires that the authentication webhook is enabled on the worker nodes. Currently this is not enabled by default. We will be releasing a change to enable this in early 2020. Until then, customers can execute the following common on the AKS worker nodes (using SSH, vmss commands, etc) - this change will not persist through an upgrade or scale out.
Please test, verify and re-verify all commands in test systems/clusters to ensure they match your configuration
Using the Azure CLI (VMSS cluster):
After this is done, run
systemctl restart kubeleton the worker nodes.You can install the operator using helm: https://github.com/helm/charts/tree/master/stable/prometheus-operator
Warning: Deployments such as this with lots of containers (istio as well) may fail temporarily, please re-run the installation after deleting the namespace if this occurs. This happens due to existing IO saturation/throttling, large deployments / deployment load will also trigger this issue.
For more information, please see: https://github.com/helm/charts/tree/master/stable/prometheus-operator.
The issue investigation walkthrough below uses the prometheus-operator.
Identification using Azure Monitor
Customers can enable the following metrics at the AKS cluster nodepool and VM instance level. These do not show all of the metrics and data exposed by the prometheus operate and what is failing, but does indicate the problem is occurring and how severe the load is.
UPDATE 02/06/2020: Linux OS disk queue depth as represented in the portal - and in general - is not a valid indicator of this issue. We have invalidated this metric and are working deploying eBPF tracing and other metrics to assist customers with identification. For now we recommend using the
prometheus-operatorUSE Method (Node) and Container operation latency reports:Below is an example view - all spikes in the OS disk queue depth were the result of IO throttling:
For more on linux bock device settings and queues, see "Performance Tuning on Linux — Disk I/O" and "Improving Linux System Performance with I/O Scheduler Tuning.
Investigation using prometheus-operator
What follows is an example root-cause investigation using the prometheus operator data.
For this test, the cluster is 5 nodes, with the prometheus operator installed, as well as istio (default configuration). Symptoms including API server disconnects, lost pods/containers and system latency were identified between 2019-12-16 22:00 UTC - 2019-12-17 01:00.
From the USE Cluster grafana chart:
We can see that load was pretty spiky, but there were periodic peaks well above the average. This is reflected in the Disk IO charts at the bottom - Disk IO Saturation specifically shows periodic heavy spikes - this is the saturation/throttle scenario.
Going to the first node in the USE Node chart:
Zooming in:
Now we correlate that window of time in the Node chart (host metrics):
The impact is shown in the Kubelet chart:
Those spikes should not be occurring.
Examining the same cluster for a different window of time (all events follow the same pattern), but zooming in on the IO / operation view:
As you can see, a spike in the throttle/disk saturation causes significant latency to container_sync and other critical container lifecycle events. Pod sandboxes, liveliness probes, etc also begin to timeout and fail.
These failures ripple through the entire stack above - from the view of a running application this would look like widespread deployment/container timeouts, slow performance, etc.
Shifting to the pod utilization/load per node, there's an additional jump and churn in the utilization of the
tunnelfrontpod - these pods act as the bridge between your worker nodes and the API server, during this period the API server would seem slow to respond or timed out due to the impact totunnelfrontbeing unable to read from it's socket:The prometheus operator offers a consistent set of defaults and metrics that allows a deeper look into possible operational issues impacting worker nodes. We will continue to iterate on additional support and other prometheus-operator extensions (such as alertmanager configurations).
Please contact and work with Azure support to identify if you're impacted by this issue
The text was updated successfully, but these errors were encountered: