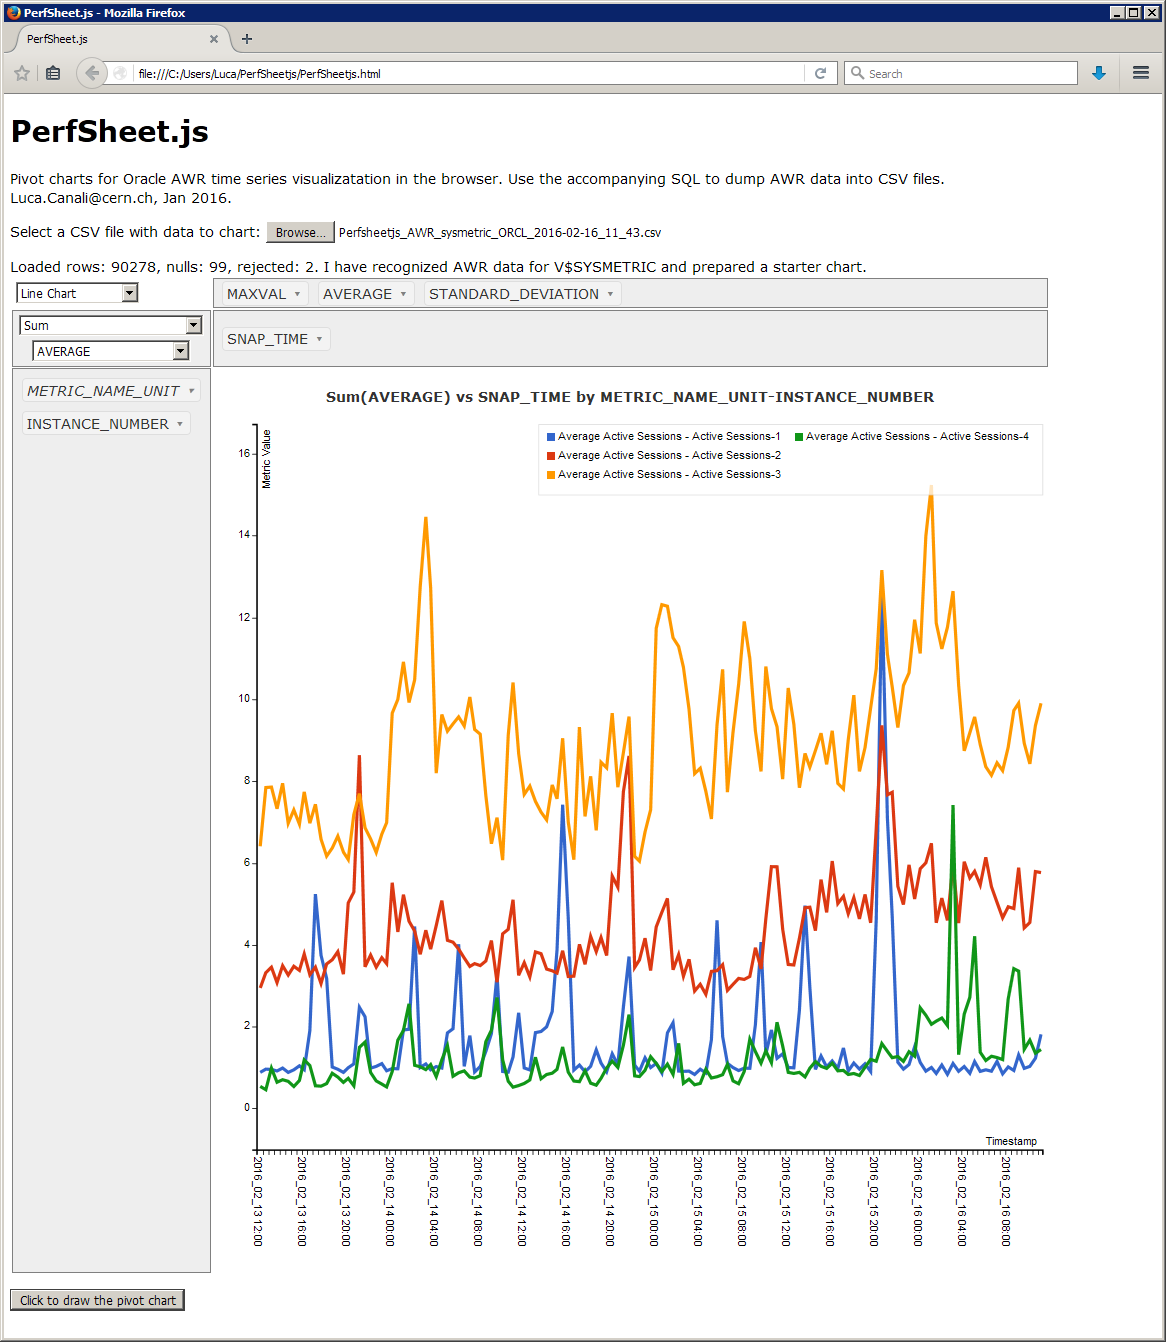
A tool for Oracle performance analysts.
It provides a simplified interface to extract and visualize AWR time series data using pivot tables in the browser using javascript.
For Oracle 11.2 and higher
Author and contact: Luca.Canali@cern.ch
Created: January 2016, last updated Oct 2019.
Get started:
- download and open PerfSheetjs.html in the browser
- play with visualization using csv files in the example_data folder
- extract AWR data for visualization from your DBs using the scripts in sqlplus_scripts folder
Accompanying blog entry: https://db-blog.web.cern.ch/blog/luca-canali/2016-02-perfsheetjs-oracle-awr-data-visualization-browser-javascript-pivot-charts
Getting started video: https://www.youtube.com/watch?v=kM0c8Nz15_s
The goal of PerfSheet.js is to make the analysis of AWR data easier by providing a graphical interactive interface and by automating several repetitive steps of data extraction and chart preparation. Pivot charts provide a flexible and easy to use way to navigate around the many metrics and dimensions of AWR data. PerfSheet.js spins off from the work on PerfSheet4. While PerfSheet4 runs in MS Excel. PerfSheet.js is written in javascript and runs in the browser. This provides extra flexibility and compatibility across platforms. The main components of PerfSheet.js are:
- Visualization with interactive pivot charts. This is implemented using PivotTable.js by Nicolas Kruchten.
- Additional customization provide pre-configured starter charts and a basic interface to load data from CSV files.
- A set of SQL scripts to extract performance metrics of interest from Oracle AWR tables into CSV files.
- A few example data files come with the tool, to help first-time users.
Notes:
- Multiple DBIDs
- You will need to do some (simple) updates if your AWR repository has multiple DBIDs (I typically work with only 1 DB per AWR repository). If you look at the scripts you will find commented out "--ss.dbid, --uncomment if you have multiple dbid in your AWR"
- PDBs
- Oracle container databases are currently not supported, it's a matter of improving the scripts and is in the TODO list.
References and acknowledgements
PerfSheet.js is based on PivotTable.js by Nicolas Kruchten.
Additional dependencies include: C3.js, D3.js, jquery, jquery-ui, PapaParse.
PerfSheet.js is based on previous work on PerfSheet4 which in turn is based on original work by Tanel Poder.
