Welcome to the Cyclistic bike-share analysis case study!.the marketing analyst team at Cyclistic, a bike-share company in Chicago. The director of marketing believes the company’s future success depends on maximizing the number of annual memberships. Therefore, your team wants to understand how casual riders and annual members use Cyclistic bikes differently.From these insights,your team will design a new marketing strategy to convert casual riders into annual members.
we want to convert casual riders into annual members. because success and profits depend on the number of annual members
- What is the percentage of casual and member riders?
- How do annual members and casual riders use Cyclistic bikes differently?
- Which stations have the most riders?
- Why would casual riders buy Cyclistic annual memberships?
- How can Cyclistic use digital media to influence casual riders to become annual riders?
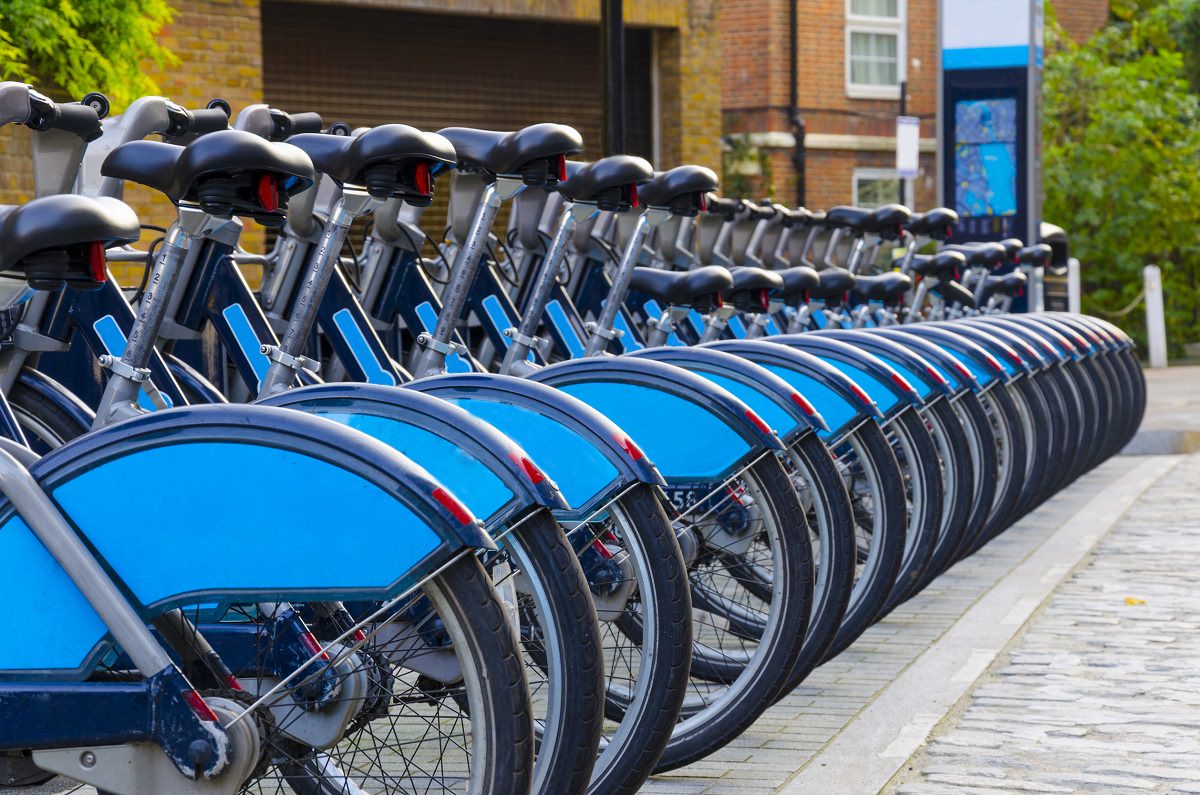
I used Cyclist’s historical trip data to analyze and identify trends. I Download the previous 12 months of Cyclistic2020 trip data here.
I used Python and their library like pandas,Seaborn,NumPy
- Append 12 CSV files into one file
- Clean null and remove duplicated values
- Change the data type to be the right format for specific columns
- Sort and filter data
All process here using jupyter notebook
| Description | Casual Member | Annual Member |
|---|---|---|
| Percentage | 39% | 61% |
| Common start station | Streeter Dr & Grand Ave | Clark St & Elm St |
| Common end station | Streeter Dr & Grand Ave | Clark St & Elm St |
| Common start and end station | Streeter Dr & Grand Ave | MLK Jr Dr & 29th St:State St & 33rd St |
| Average ride length | 20.79 Minutes | 17.72 Minutes |
| Max ride length | 59 Minutes | 59 Minutes |
| Common hour | 17 | 17 |
| Common day | Saturday | Wednesday |
| Common month | August | August |
| Common rideable type | docked_bike | docked_bike |
| Count start Stations | 687 | 683 |
| Count end Stations | 689 | 681 |
| First_100_start_startion | .54% of trips | .49% of trips |
| End_100_start_startion | .55% of trips | .49% of trips |

- The percentage of causal is 39% and the member is 61%

- The common month for casual riders is August
- .71% of trips happen from June: September

- The docked bike is the most common with .86% of all bikes

- Saturday is most common day

- The common month for Annual member riders is August
- .61% of trips happen from June: September

- The docked bike is the most common with .85% of all bikes

- Wednesday is most common day
We have noticed that .71 of casual riders trips happens between June: September and the majority of them use docked bikes. after grouping all 687 stations we found that the first 100 stations represent .54% of trips. the rush hour for the casual and annual members is 17.and most of them use the docked bike and use bikes more often in the third quartile.
- Marketing analysis team should advertise in those months.
- Make a good plan to make a discount for those 100 stations.
- Make a good deal with companies fall in that area because the rush hour 17 means that they use bikes to back to their home