Important
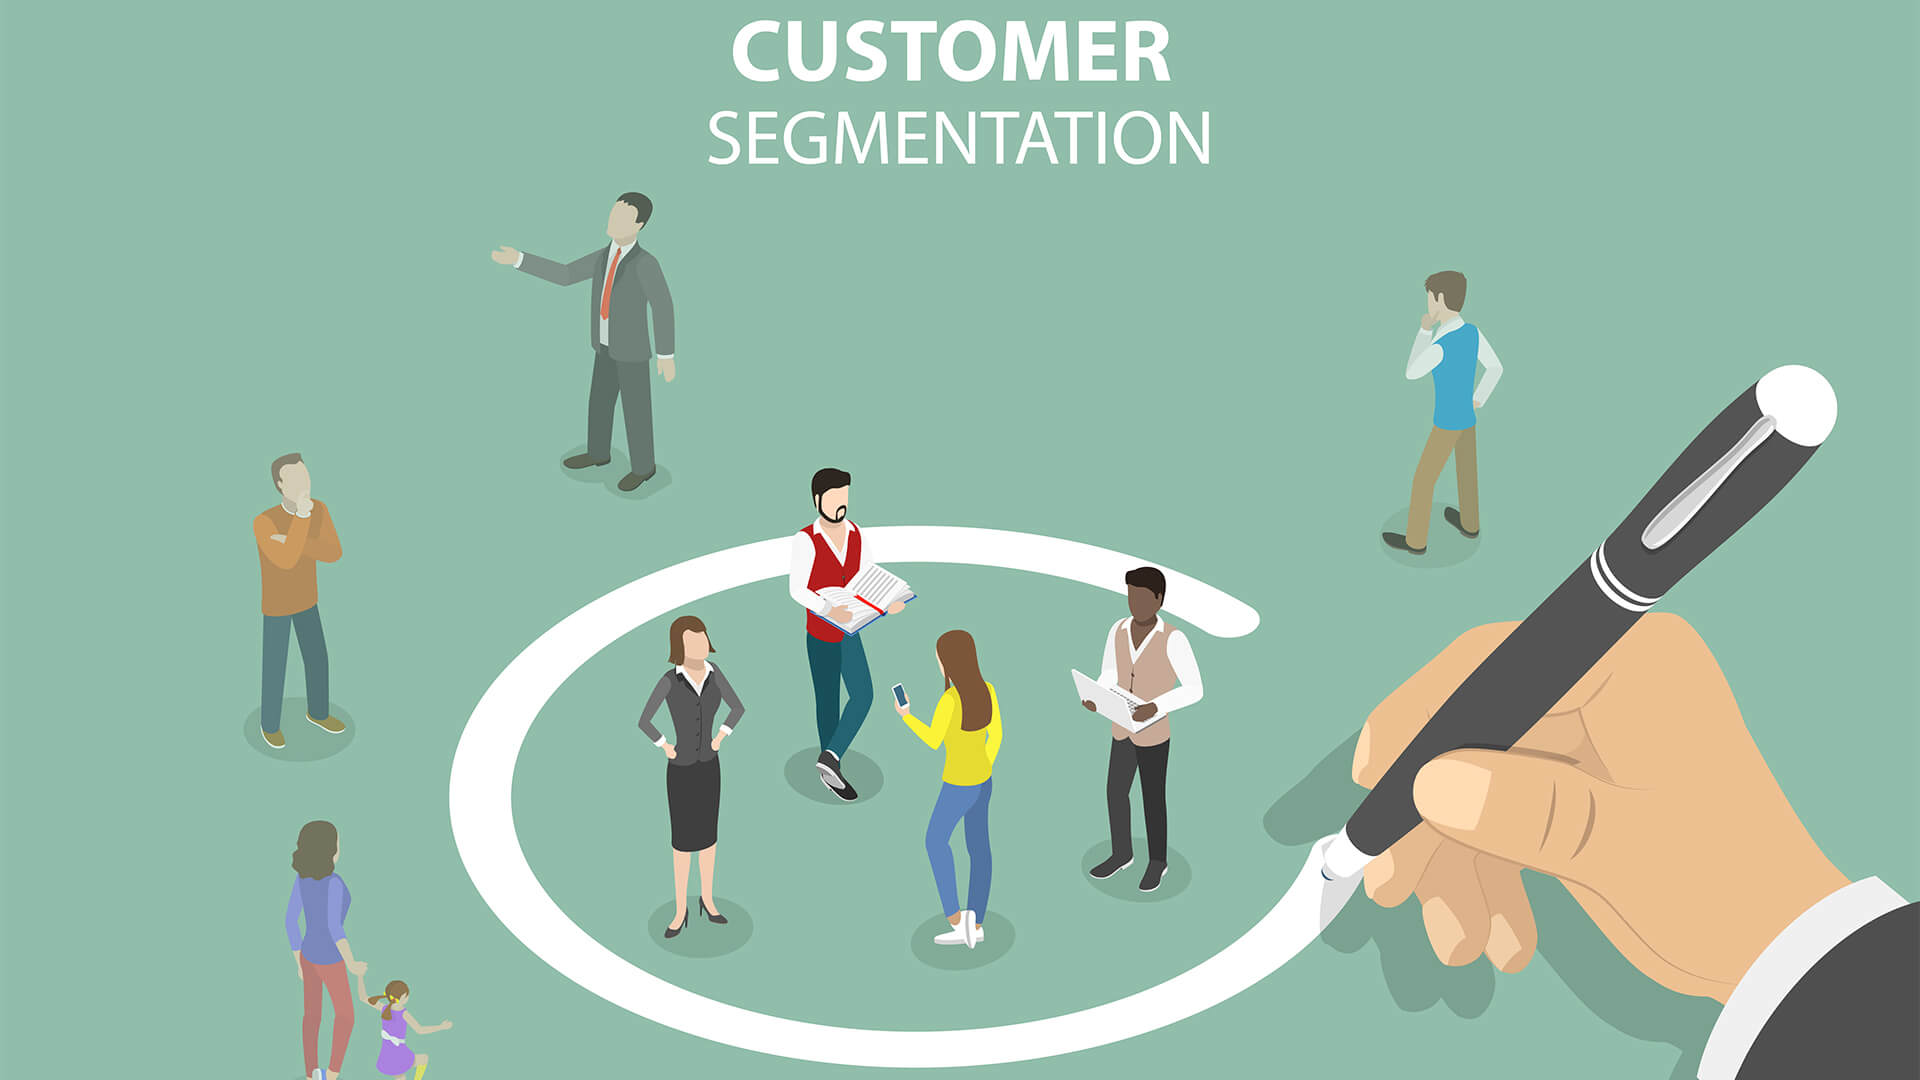
In American politics, a party leveraged detailed data to categorize individual voters, tailoring content to sway opinions. My project draws inspiration from this, exploring how businesses apply a similar concept—customer segmentation. It involves sorting customer feedback to understand and strategically influence their buying choices. Just like in politics, where personalized messages impact voters, businesses target customers based on preferences, underscoring the crucial role of customer segmentation in shaping both political opinions and purchasing decisions.
For any business to run in the most efficient and successful way, the primary aspect of that business should be customer retention. In other words, it's the ability of the company to turn customers into repeated buyers of their product or service. For any Files related to data or code have a look on the left panel.
Companies effectively using customer segmentation strategies experience a 36% increase in revenue (Source: Aberdeen Group).
Within the vast array of reviews a company receives, we meticulously classify them into three distinct categories: positive, neutral, and negative. This segmentation enables us to effectively target positive, negative, and neutral customer segments with specific marketing strategies, maximizing the benefits for the company.
Nothing can be built from a void. Ever wondered why every supermarket, multiplex, airlines, any form of proper business asks for feedback? Is it just for improvising? Absolutely no, so what else is the question. Let's dive deep and see what else...
The complete data that is dealt with in this project is here.
There are two types of data:
-
Customer Reviews Data:
- The first dataset consists of customer reviews. These reviews gathered as feedback on the company's website, have been web-scraped using a library called BeautifulSoup in Python. For a more detailed overview, you can find the source code.
- The actual customer feedback that is collected through scraping. There are a total of 10,000+ records collected.
-
Customer Booking Data:
- The second type of data is the customer booking data, which includes details about flight time, price, duration, etc.
- You can access the customer booking data here. This dataset comprises 50,000+ records with 7+ main metrics.
import requests
from bs4 import BeautifulSoup
import pandas as pd
All the code for data collection is available here.
The term "Pre-processing" itself says that data is handled "PRE" (before) processing into the code. It has two main steps Cleaning and feature engineering.
The available or collected data is often in a raw state, characterized by duplicate entries, null values, and a lack of structure. This raw state can be compared to chopping vegetables before cooking. To prepare the data for analysis, it requires cleaning and transformation:- Removal of duplicate entries.
- Addressing null values.
- Changing the unstructured format to a structured one.
Just like preparing ingredients before cooking, this data-cleaning process is essential before diving into the analysis or data analysis "recipe." The objective is to have a clean and organized dataset, ready for analysis—a necessary step before embarking on the analytical journey, much like having ingredients neatly prepared before starting to cook a delicious meal. Here a new feature is added that is SENTIMENT after performing sentiment analysis, to study the percentage of customers who stays Positive, Negative and Neutral towards a service.
# Apply sentiment analysis and categorization to each comment
data['Sentiment'] = data['Reviews'].apply(lambda x: categorize_sentiment(analyse_sentiment(x)))
Every time feedback is given, it's molded to segment users so that each individual part is dealt with accordingly by the sales and marketing team.
In-depth, understanding whether a customer will choose to engage with a company again hinges on the feedback they provide. Although the feedback process is inherently straightforward, its significance lies in our ability to predict a customer's likelihood of returning.
pandas
numpy
textblob
scikit-learn
To view the requirements.txt file here.
|
4.2:Keyword Identification: Identifying the most dominant factors customers look for:
|

↑ Discover Dominant Keywords |
import boto3
#Bucket and file paths
bucket_name = 'customersegmentation60k'
customer_booking_path = 'sagemaker/customersegmentation/sklearnconatiner/customer_booking.csv'
sentiment_analysis_path = 'sagemaker/customersegmentation/sklearnconatiner/Polarity.csv'
#Creating an S3 client
s3 = boto3.client('s3')
#Upload required data
s3.upload_file('Vk/downloads/customer_booking.csv', bucket_name, customer_booking_path)
s3.upload_file('Vk/downloads/Polarity.csv', bucket_name, sentiment_analysis_path)
## Importing all the neccessary libraries.
import boto3
import sagemaker
import pandas as pd
import pickle
from sklearn.ensemble import RandomForestClassifier
from sklearn.metrics import accuracy_score
from sklearn.model_selection import train_test_split
from sagemaker import get_execution_role
from sagemaker.model import Model
import matplotlib.pyplot as plt
S3 stores data for ML in a bucket, accessed by SageMaker's Jupyter. For instance, predicting house prices using a dataset stored in S3 via SageMaker's Jupyter.
First, in Jupyter Notebook 1, we develop machine learning code on Amazon SageMaker using customer segmentation data. This code becomes a model deployed as an endpoint.
Now, in Jupyter Notebook 2, we use Streamlit. It acts as an interface for users to input data. Streamlit takes care of collecting user input and generates requests. These requests are then forwarded to the SageMaker endpoint, where the model processes them to make predictions. In essence, Notebook 1 builds the model, and Notebook 2 handles user interactions and facilitates predictions using that model.
predictor = model.deploy(instance_type="ml.m5.large", endpoint_name="your-endpoint-name")
The core of this project lies at building an model and that's here....
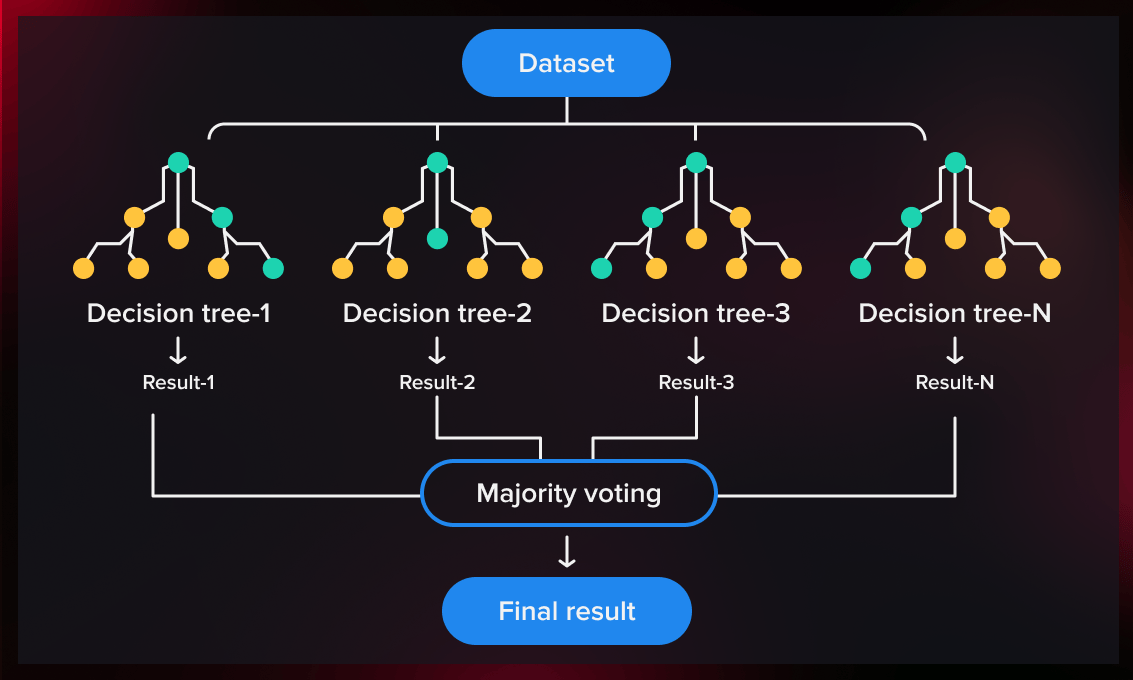
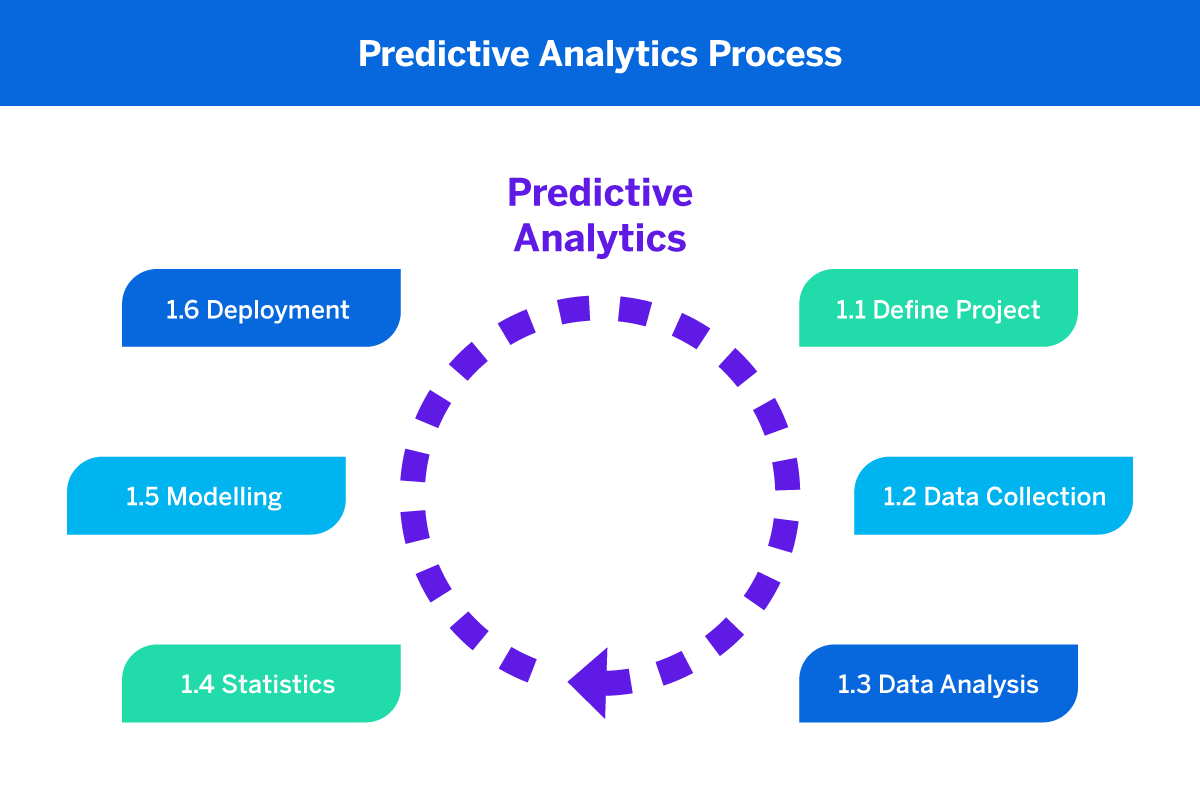
Additional data is gathered and collected, including booking data (buying data). Along with the web scraping data, this collected data is used to build a predictive machine learning model. In this case, the model used is the random forest classifier, which can predict whether or not a given customer with given metrics will buy the product or service of the company.
# Create a Random Forest classifier
clf = RandomForestClassifier(n_estimators=100, random_state=1)
It's not just dumping data in the model, it is about the selection of that model, to tell the story behind the data and predicting something that makes sense in a practical way ! Random Forest Classifier Usage:
The Random Forest classifier is utilized by inputting data from the customer booking data matrix. This matrix incorporates features like flight time, hours traveled, and other relevant metrics. The primary goal is to predict whether the customer will make a repeat purchase from the company.
Model Performance:
The model's predictive performance is assessed using the Precision score, achieving an accuracy rate of 80%. This signifies a commendable level of precision in predicting positive instances, indicating a successful outcome.
Few important metrics taken as input for a good predicted output include: 'purchase_lead', 'length_of_stay', 'flight_duration' to predict the booking output. The model achieved an accuracy score of 80%.
- Ref 1: Airline Quality - Website where data is webscrapped
- Ref 2: Towards Data Science - Understanding TextBlob and NLP
- Ref 3: scikit-learn Documentation - Understanding the models
After meticulously collecting and analyzing customer feedback, it's evident that customers fall into two distinct types: those who actively provide feedback (Type 1) and those who do not (Type 2). The essence of this project revolves around understanding customer behavior and satisfaction levels.
The primary objective is to segment customers based on their satisfaction levels. Each segment is then channeled into specific marketing strategies, ensuring a tailored approach to maximize the chances of customers returning for the same product or service. By studying and responding to customer feedback, businesses can enhance customer satisfaction and loyalty, ultimately contributing to their overall success.


