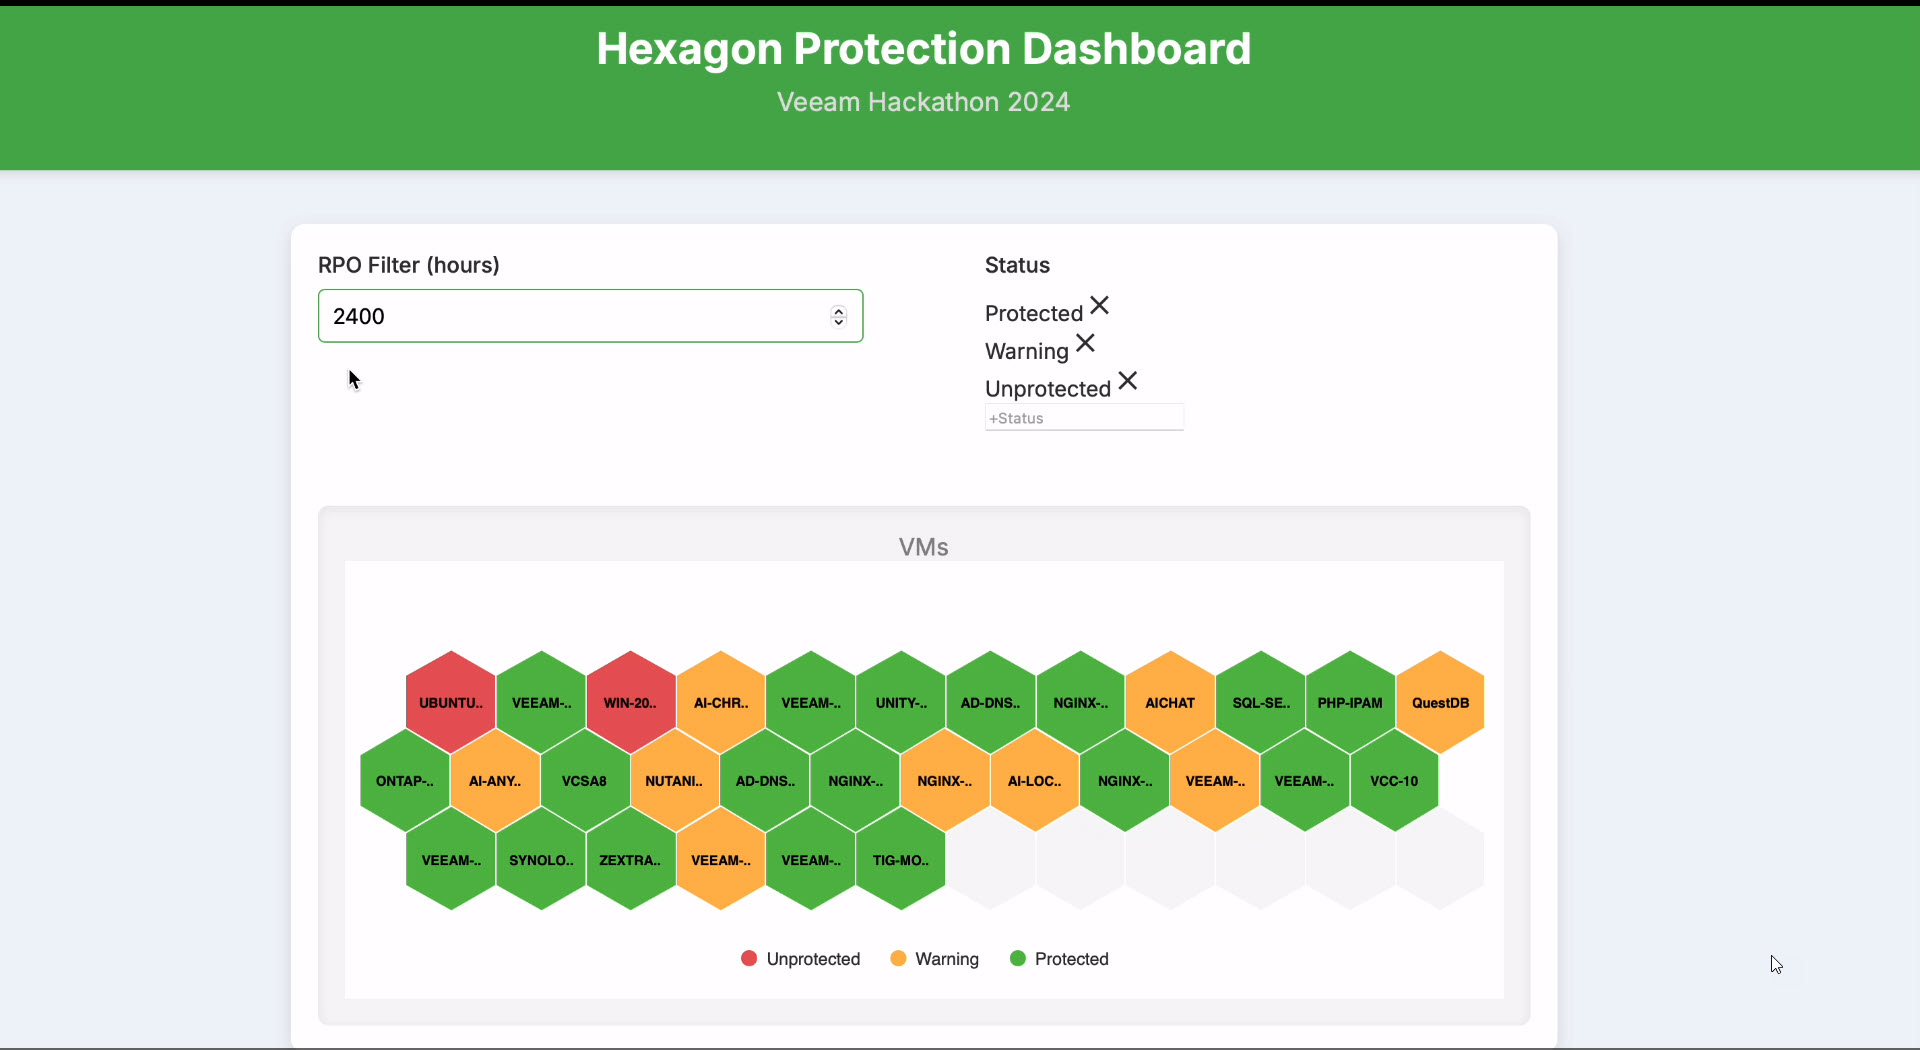
Welcome to the Hexagon Protection Dashboard, a powerful visualization tool designed for the Veeam Hackathon 2024. This Node.js application connects to your VeeamONE server to fetch data about protected and unprotected virtual machines (VMs), displaying them in an interactive hexagon map for quick and intuitive analysis.
Managing and monitoring the protection status of virtual workloads can be challenging. The Hexagon Protection Dashboard addresses this by providing:
- Immediate Visualization: Quickly identify unprotected VMs with a glance at the hexagon map.
- Interactive Filters: Toggle between protected and unprotected workloads to focus on what matters.
- Real-Time Updates: Adjust your desired Recovery Point Objective (RPO) and see instant changes.
- Enhanced Decision-Making: Prioritize actions based on visual cues and comprehensive data.
- User Authentication: Securely connect to your VeeamONE server using your credentials.
- REST API Integration: Fetch real-time data about your VMs directly from VeeamONE.
- Hexagon Map Visualization: Experience an aesthetically pleasing and informative display of your workloads.
- Customizable RPO Settings: Define your RPO threshold to highlight VMs that require attention.
- Status Filtering: Easily switch between viewing protected and unprotected VMs.
- Authentication: Enter your VeeamONE server URL, username, and password.
- Data Fetching: The application uses REST API calls to retrieve information about your VMs.
- Data Processing: It calculates the protection status based on the latest restore points and your RPO settings.
- Visualization: Displays the VMs in a hexagon map, color-coded by their protection status.
- Interaction: Adjust filters and RPO settings to dynamically update the visualization.
+----------------+          +-----------------+          +--------------------+
| User Input     |   --->   | Authenticate    |   --->   | Fetch VM Data      |
| (Server URL,   |          | with VeeamONE   |          | via REST API       |
| Username,      |          +-----------------+          +--------------------+
| Password)      |
+----------------+
                                                                            |
                                                                            v
+-----------------------------------------------------------------------------------+
| Process Data: Calculate Protection Status based on Latest Restore Points and RPO  |
+-----------------------------------------------------------------------------------+
                                                                            |
                                                                            v
+----------------+          +------------------+         +--------------------+
| Hexagon Map    |  <---    | Real-Time Updates|  <---   | User Interaction   |
| Visualization  |          | (Filters & RPO)  |         | (Adjust RPO,       |
|                |          +------------------+         | Toggle Status)     |
+----------------+ -
Clone the Repository
git clone https://github.com/VeeamCommunity/veeamcommunity-2024-Team-2.git
-
Navigate to the Project Directory
cd veeamcommunity-2024-Team-2 -
Install Dependencies
npm install
-
Start the Server
node server.js
To start the server with mock data, use:
node server.js --mockThis will allow you to view synthetic data without needing an actual Veeam One installation. Fill in the login credentials with dummy data to access the mock environment.
- Access the Application
Open your web browser and navigate to:
http://localhost:3000-
Login
- Enter your VeeamONE Server URL and Port (e.g.,
https://veeamone.example.com:1239). - Input your Username and Password.
- Click Login to authenticate and fetch data.
- Enter your VeeamONE Server URL and Port (e.g.,
-
Explore the Dashboard
- Hexagon Map: View your VMs displayed as hexagons.
- Red Hexagons: Unprotected VMs needing immediate attention.
- Green Hexagons: Protected VMs within the desired RPO.
- Filters:
- RPO Filter: Adjust the RPO value to redefine protection thresholds.
- Status Filter: Toggle between viewing protected and unprotected VMs.
- Hexagon Map: View your VMs displayed as hexagons.
- Server-Side Logic: Handles authentication and data fetching from the VeeamONE API.
- Located in
server.js.
- Located in
- Visualization Logic: Processes data and renders the hexagon map using Highcharts.
- Found in
visualizer/Visualizer.js.
- Found in
- Front-End Interface: Provides the user interface for interaction.
- HTML and CSS files in the
publicdirectory.
- HTML and CSS files in the
We welcome contributions from the community! If you have ideas for improvements or have found bugs, please:
- Create an Issue: GitHub Issues
- Submit a Pull Request: For code changes and enhancements.
For more detailed information, refer to our Contributing Guide.
This project is licensed under the MIT License.
If you have any questions or need clarification, please don't hesitate to create an issue and let us know!
Thank you for using the Hexagon Protection Dashboard! We hope it enhances your VeeamONE experience.
