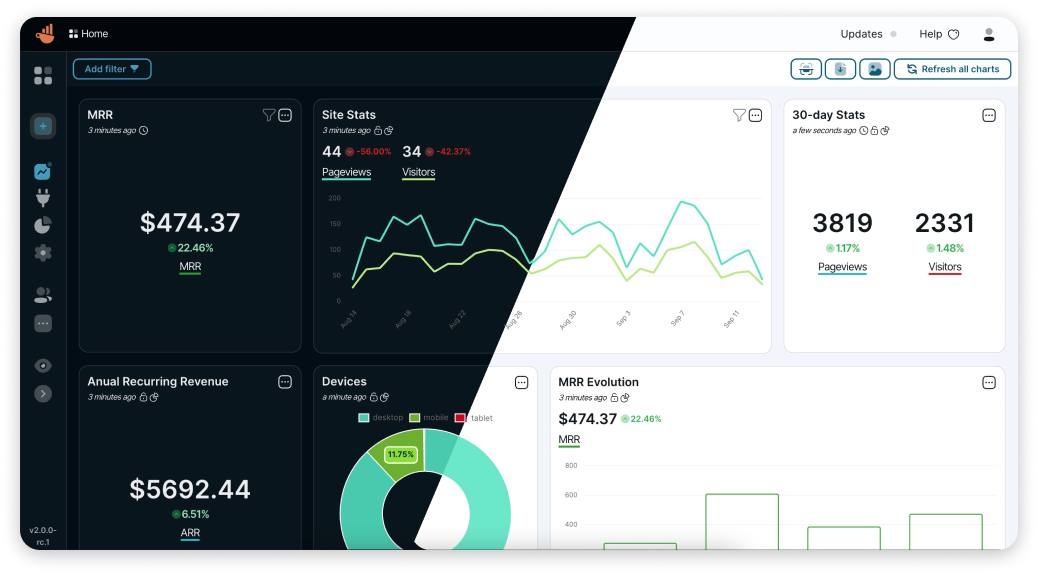
Chartbrew is an open-source web application that can connect directly to databases and APIs and use the data to create beautiful charts. It features a chart builder, editable dashboards, embedable charts, query & requests editor, and team capabilities.
Chartbrew as a service is available here
💡 Have any ideas or discussion topics?
Check Chartbrew's website for the latest list of supported data sources
- NodeJS v14, v16, v18
- MySQL (5+) or PostgreSQL (12.5+)
It is recommended you head over to the more detailed documentation to find out how to set up Chartbrew
Chartbrew can run on MySQL or PostgreSQL. Create an empty database that Chartbrew can use.
git clone https://github.com/chartbrew/chartbrew.git
cd chartbrew && npm run setup
Complete the required environmental variables in chartbrew/.env. Check out which need to be set here.
Open two terminals, one for front-end and the other for back-end.
# frontend
cd client/
npm run start

# backend
cd server/
npm run start-dev
Head over to http://localhost:4018 to see the app running and create your first user account.
Read more on how to do this here
Check the full guide in the docs.
A Chartbrew docker image is built whenever a new version is released.
Before running the commands below, make sure you have a MySQL server already running and an empty database that Chartbrew can use. The database name should match the value of the CB_DB_NAME variable.
docker pull razvanilin/chartbrew

docker run -p 4019:4019 -p 4018:4018 \
  -e CB_SECRET=enter_a_secure_string \
  -e CB_API_HOST=0.0.0.0 \
  -e CB_API_PORT=4019 \
  -e CB_DB_HOST=host.docker.internal \
  -e CB_DB_PORT=3306 \
  -e CB_DB_NAME=chartbrew \
  -e CB_DB_USERNAME=root \
  -e CB_DB_PASSWORD=password \
  -e REACT_APP_CLIENT_HOST=http://localhost:4018 \
  -e REACT_APP_API_HOST=http://localhost:4019 \
razvanilin/chartbrewMany thanks to everybody that contributed to this open-source project 🙏


