
- Intro to machine learning
- Regression Vs Classification
- Linear Regression
- Reducing Loss
- Training and Testing sets
- Logistic Regression
- First Steps with some frameworks
- Tasks
-Supervised learning is the machine learning task of learning things based on classified examples and previous data. This previous data is called training data which consists of a set of training examples.
For example you have to arrange some animals as "duck" or "not duck"
You already know from your previous work about the physical characters of duck.
Now classify the animals using this learned data.
Your previous work is called training data.

Information extraction
Object recognition in image processing
Pattern recognition
Speech recognition
(I kind of like to imagine it as a human named tarzan who lives in jungle seeing two different animals!)
In unsupervised learning you train an machine learning model using data that is neither classified nor labeled.
As you can see, the most common method for unsupervised learning is clustering.

The goal for unsupervised learning is to model the underlying structure or distribution in the data in order to learn more about the data.
remind me to make you play a game of 2 cars!

Continuos learning process,with self improvement,based on rewards.
Application Example:Self Driving car.
We can say that reinforcement learning is semi supervised. In supervised learning we create “models”, a model is basically a function that takes in simple inputs and produces useful predictions. Here we have features and labels in the dataset.
A feature is an input variable—the x variable . . A simple machine learning project might use a single feature, while a more sophisticated machine learning project could use millions of features.The learning is done by understanding the features.
Features of sem exam scores for predicting ML model can be,
- Total number of hours spent studying the day before exam.
- previous knowledge from +2 topics.(Brilliant pala students please step back!!)
- Love for PUBG 😉
A label is the thing we're predicting. It can be the price of a product, class probability in a classification.
An example is a particular instance of data, x. (We put x in boldface to indicate that it is a vector.) We break examples into two categories:
•labeled examples
•unlabeled examples
A labeled example includes both feature(s) and the label. That is:
labeled examples: {features, label}: (x, y)
Use labeled examples to train our Model
Supervised learning problems can be further grouped into regression and classification problems.
A classification problem is when the output variable is a category, such as “red” or “blue” or “disease” and “no disease”.
A regression problem is when the output variable is a real value, such as “dollars” or “weight”.
A regression model is used to predict continuous values.
For example,
- The probability of winning the chicken dinner after several retries.(PUBG fans can relate!)
- Price of petrol in India.
A classification model predicts discrete values. It can make predictions that answer questions like,
- Is this an image of a cat or dog or Priya prakash warrier.
- Predicting whether a movie belongs to DC or Marvel(based on the dark scree(and humour) may be).
Linear regression is a method for finding the straight line or hyperplane that best fits a set of points.
The line equation is,
y = mx + b
In machine learning we use this convention instead,
y' = b + w1x1
Where,
- y' is the label we are predicting.
- b is the bias.(does the same thing what a constant c does to the line equation.Determines if to pass through origin or not)
- w1 is the weight of feature 1. Weight is the same concept as the "slope" in the traditional equation of a line.
- x1 is a feature (a known input).
To predict, just substitute the x1 values to the trained model.
A sophisticated model can use more than one features.
y' = b + w1x1 + w2x2 + w3x3 + .... + wNxN
here, x1,x2,x3 are the different different features which predict for the label.

-
Training a model simply means learning (determining) good values for all the weights and the bias from labeled examples.
-
In supervised learning, a machine learning algorithm builds a model by examining many examples and attempting to find a model that minimizes loss; this process is called empirical risk minimization.
-
Loss is the penalty for a bad prediction. If the model's prediction is perfect, the loss is zero; otherwise, the loss is greater.
-
The goal of training a model is to find a set of weights and biases that have low loss, on average, across all examples.
First we have to find the loss.
L2 Loss/square loss is a popular loss function. It is the given as
= the square of the difference between the label and the prediction
= (observation - prediction(x))**2
= (y - y')**2
We need a function that will minimize the parameters over our dataset. One common function that is often used is mean squared error, which measure the difference between the estimator (the dataset) and the estimated value (the prediction). Mean square error (MSE) is the average squared loss per example over the whole dataset.

Likelihood Loss is also a relatively simple , and commonly used used loss function used in classification problems.The function takes the predicted probability for each input example and multiplies them.
Let the probabilities of outputs be [0.4,0.5,0.7,0.1] for the ground truth labels of [0, 1, 1, 0].
                           Likelihood Loss = (0.6)*(0.5)*(0.7)*(0.9)

          Since the model outputs probabilities for TRUE(or 1) only, when the ground truth label is 0
          we take (1-p) as the probability. In other words, we multiply the model’s outputted probabilities
          together for the actual outcomes.
Log Loss is a loss function also used frequently in classification problems, and is one of the most popular measures for Kaggle competitions. It’s just a straightforward modification of the likelihood function with logarithms.
Log loss = -(ylog(p) + (1-y)log(1-p))
This is actually exactly the same formula as the regular likelihood function, but with logarithms added in.
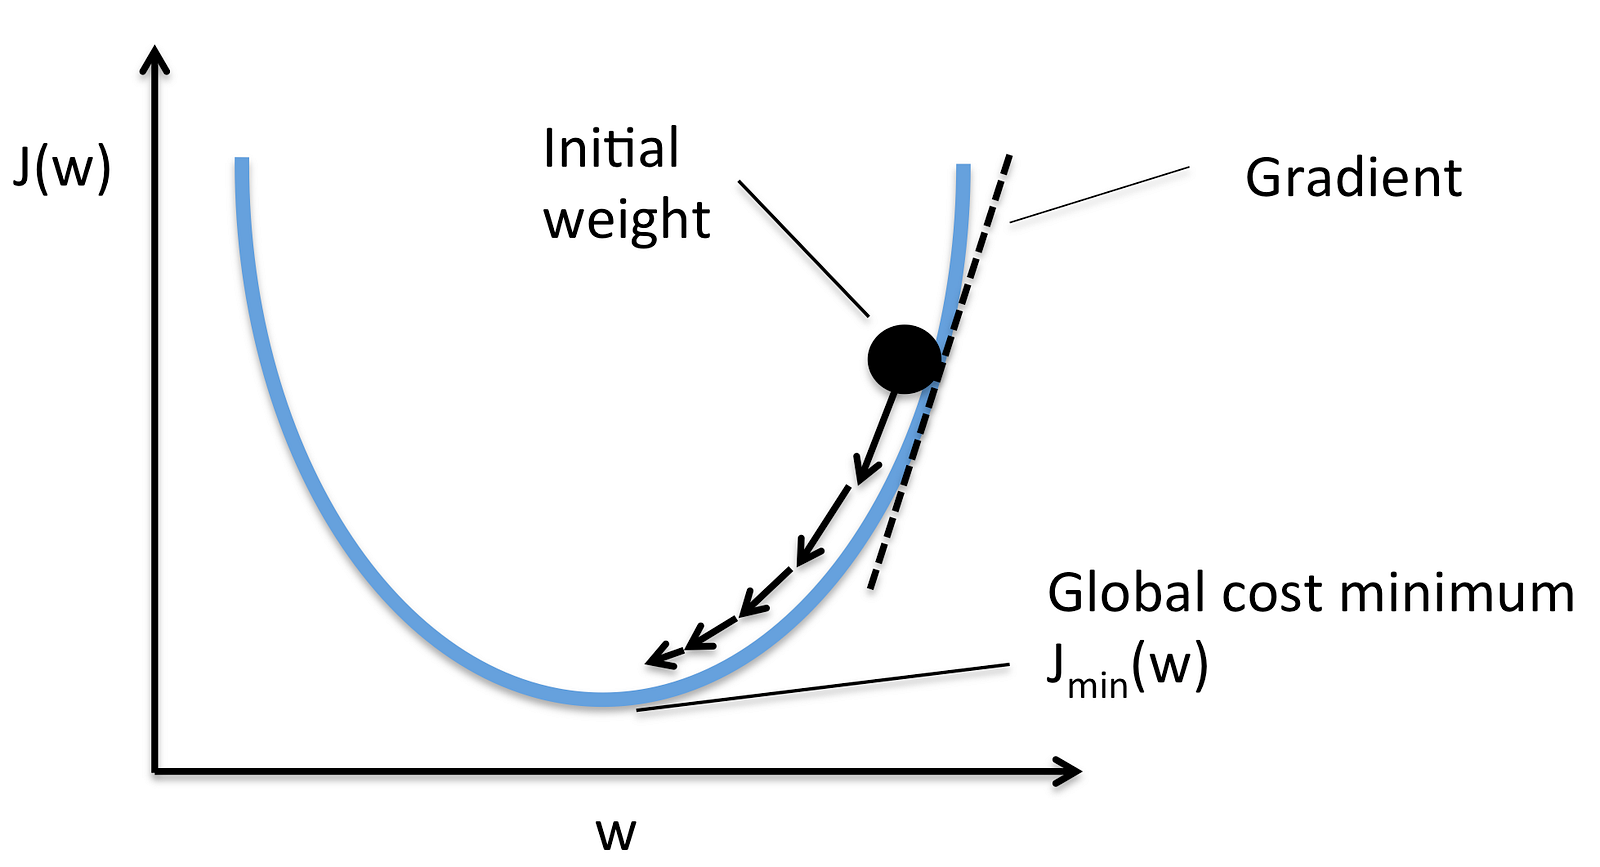
Reducing the loss is similar to the **"Hot and cold game"** kids play!(Hot if youre nearer,cold if youre not.)A Machine Learning model is trained by starting with an initial guess for the weights and bias and iteratively adjusting those guesses until learning the weights and bias with the lowest possible loss.
Gradient Descent is a general function for minimizing a function, in this case the Mean Squared Error cost function.


-
Our goal is to create a machine learning model that generalizes well to new data.
-
We train the model using a Training set and the test set act as a proxy for new data!
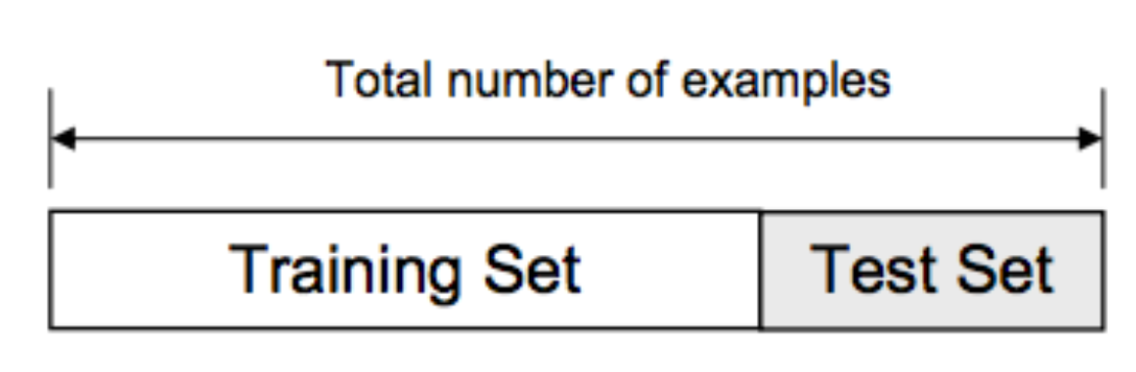
- training set — a subset to train a model.
- test set — a subset to test the trained model.
- Many problems require a probability estimate as output.
- Logistic regression is an extremely efficient mechanism for calculating probabilities.
For example, consider that the probability of coconut falling on someone's head while walking through a field is 0.05. Then over the year 18 accidents will happen in that field because of coconut!
P(thenga|day) = 0.05
coconut falling on head =
0.05*365
~= 18
-
An activation function produces an output.
-
In logistic regression we do the sum of products of inputs(X) and their corresponding weights(w) and apply an Activation function.
-
There are different types of activation fuctions like sigmoid function, hyperbolic tangent function(tanh), Rectified Linear Activation Unit(ReLU) etc.
-
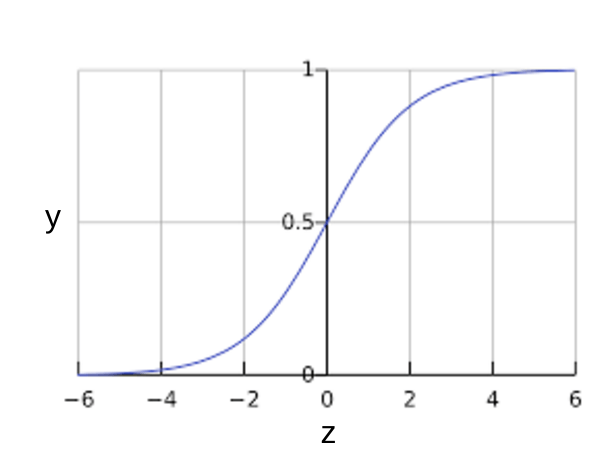
A commonly used activation function in logistic regression, a sigmoid function, defined as follows, produces output that always falls between 0 and 1. So,the aim of logistic regression is to get a probabilistic value between 0 and 1, and you can see that in the graph
Where,
y = w1x1 + w2x2 + ... wNxN
and p is the predicted output.

Linear Regression could help us predict the student’s test score on a scale of 0 - 100. Linear regression predictions are continuous (numbers in a range). Logistic Regression could help use predict whether the student passed or failed. Logistic regression predictions are discrete (only specific values or categories are allowed). We can also view probability scores underlying the model’s classifications.
Tensorflow is a computational framework for building machine learning models. TensorFlow provides a variety of different toolkits that allow you to construct models at your preferred level of abstraction. You can use lower-level APIs to build models by defining a series of mathematical operations. Alternatively, you can use higher-level APIs (like tf.estimator) to specify predefined architectures, such as linear regressors or neural networks.
Tensorflow consist of,
-
A graph protocol buffer
-
A runtime that executes the distributed graph
| Estimator (tf.estimator) | High-level, OOP API. |
| tf.layers/tf.losses/tf.metrics | Libraries for common model components. |
| TensorFlow | Lower-level APIs |
There will always be awesome deep learning frameworks for your use,like, keras,pytorch,tensorflow,etc,but I think we should start with something very light and understandable with the theory we have studied until now.
Simple and efficient tools for data mining and data analysis
Accessible to everybody, and reusable in various contexts
Built on NumPy, SciPy, and matplotlib
Open source, commercially usable - BSD license
Let's now check a code and visualize and train a small custom dataset to understand how linear regression works.
Linear_regression_sample_program
## Tasks
1)
Try this and other example tasks with scikit learn with built-in datasets.
2)Hey! what if you changed the dataset, i.e,change the training and test set values and parameters so that you can use it in your own application? May the best idea win!