timeseries / regression plot #313
Comments
|
Also, random draws from posterior are one good way to visualize the uncertainty. At least for static images. Here was some discussion about the quantiles #2 |
|
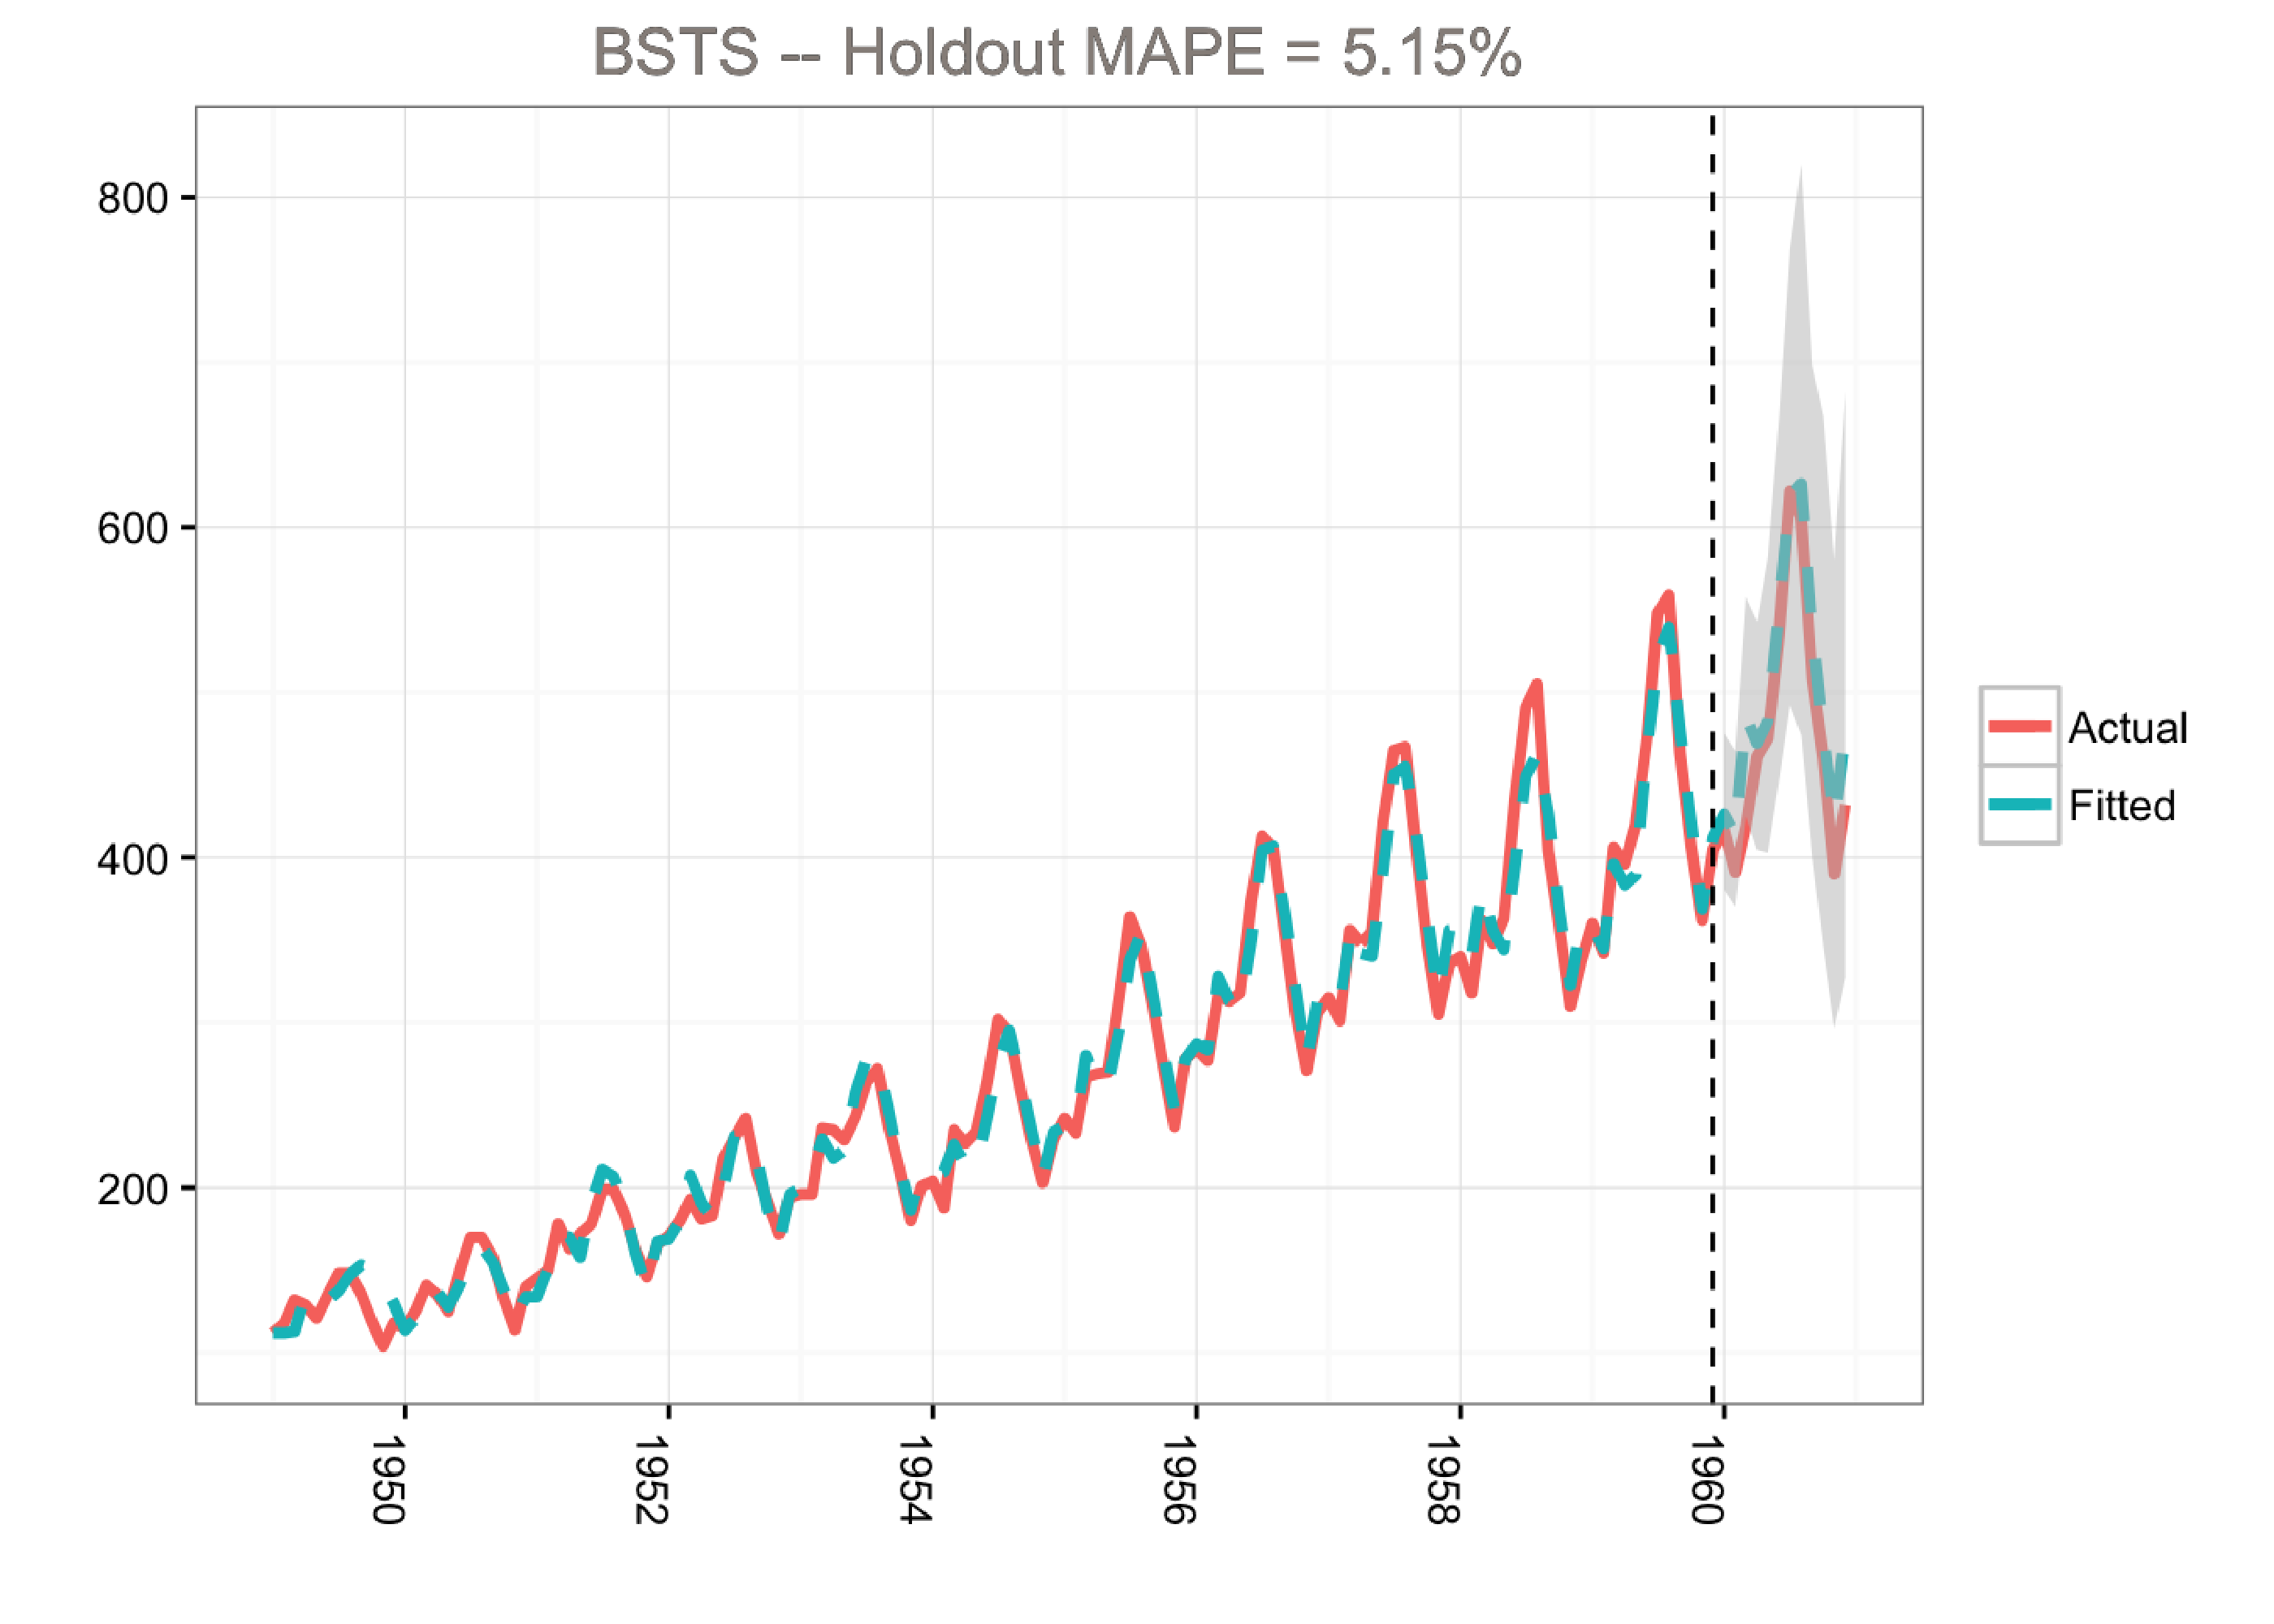
This visualization from Stitch Fix is a nice example in my opinion https://multithreaded.stitchfix.com/blog/2016/04/21/forget-arima/ |
|
I believe line plots are good representation but the best representation would obviously depend on the type of data. I propose that in short term, we should focus on integrating line plots for time series analysis and later we can add more plots to the library. I would love to work on this feature. |
|
I think that the best way to begin is probably by creating a small database of regression and timeseries models, maybe take examples from ROS https://avehtari.github.io/ROS-Examples/examples.html (it whould not be too much work to port to cmdstanpy or pystan) or using https://github.com/bambinos/Bambi_resources/tree/master/ROS and then see how they could be reproduced from ArviZ and InferenceData objects. There are many things to take into account for the plots and I think it will be useful to get a better picture of what could be supported to decide what will be supported and how. |
|
Sure. |
|
You probably won't need to reimplement them, bambi already uses ArviZ, it is more than anything to get an idea of the different possibilities regarding regression and timeseries plots and to get familiar with ArviZ+xarray usage which can be quite different from ArviZ development where xarray does not play such an important role |
|
Okay. I saw some of ROS examples too. I think it's not that hard to understand them. I am going through the examples tring to get familiar with the plots and ArviZ+xarray usage. I will keep in mind that we need to create a small database to get started. |
|
I have gone through examples in https://github.com/bambinos/Bambi_resources/tree/master/ROS. I can see that many examples generate fake data. I think the database generated/used in these 2 examples are good for time series/regression analysis |
|
What are the things we need to keep in mind while creating database. |
|
Of the top of my head (I'll try to get back here and keep adding things that may come to me later) these are some of the things to consider for the design:
|
|
Speaking of time series analysis, one compulsory field is date/years ( let say 100 years ). We can have single or multiple monitored variables( monitored over 100 years). These could be generated or taken from real databases. I think generating them would be better idea as then we could cross-validate the model. Do we need more fields? |
|
I don't think it matters the origin of the data, the goal is to visualize the results of the models, we don't need to check the model is correct as the visualization should work either way, after all, one of its goals it to check the models and see if they are working. What were you thinking when you mentioned cross validation? I may be missing something. We also have another project about refitting models that would allow implementing k-fold crossvalidation, approximate leave future out... which will probably need some plots of their own, but I think this is outside of the scope of the timeseries/regression plots, I am not even sure all the points above can be covered in a single project either, you may need to select a subset of cases to support. |
|
By cross validation, I meant, for example we generate y like this Then, in the example, we'll probably find distribution of a_hat and b_hat. We can then crossvalidate with original values (that are .2 and .3 here). I think better way is to just start with creating database with 2 fields and then add fields to it when required. |
|
Don't worry about going off track, I am just trying to keep the eye on the price, especially this year with the reduced coding period, it is crucial to define what is part of the project and what is not (even when useful and interesting too). I am not sure we have the same idea in mind when thinking about database. My proposal was to have a "database" of inferencedata objects (local files is fine, on figshare if we want that to be public) so that when you are implementing the I proposed looking into ROS because it has many examples covering a wide range of cases and already provides an implementation for all of the examples, so getting from there to inferencedata objects should be less work than trying to come up with the models/data from scratch. The bambi port is still a work in progress so I don't know how many can be taken as inferencedata "for free" from there, maybe @canyon289 can help with that. But looking at other examples/books/pakages is also perfectly fine. |
Can we take some dicts/dataframes defined in ROS examples, convert them to inferencedata using |
I guess so, it depends on what the data inside the dicts is, is the whole posterior stored as dict? posterior+observations? |
|
Maybe we could take data from |
|
I saw posteriordb. There are lots of models. I filter out some which have "time series" in keywords. for example - https://github.com/stan-dev/posteriordb/blob/master/posterior_database/posteriors/rstan_downloads-prophet.json I also took a quick look of prophet library developed by facebook. I think we can take an idea of time series plots from there too. Can we? |
|
Do we need a seperate function like |
|
I think we can close this now with plot_lm and plot_ts? @ahartikainen @canyon289 |
I think we need timeseries / regression plot.
Should it go under ppc plot?
We accept x and y
x:
y:
There are multiple ways to visualize uncertainty:
The text was updated successfully, but these errors were encountered: