Skip to content
New issue

Have a question about this project? Sign up for a free GitHub account to open an issue and contact its maintainers and the community.

By clicking “Sign up for GitHub”, you agree to our terms of service and privacy statement. We’ll occasionally send you account related emails.

Already on GitHub? Sign in to your account

Candle charts not showing candles on swift 4.2 #3818

Closed
JFERSD opened this issue Jan 15, 2019 · 4 comments
Closed

Candle charts not showing candles on swift 4.2 #3818

JFERSD opened this issue Jan 15, 2019 · 4 comments

Comments

@JFERSD
Copy link

JFERSD commented Jan 15, 2019

What did you do?

I'm updating my project to swift 4.2, updating Charts version from 3.0.3 (Swift 3.2) to lastest release 3.2.1 (Swift 4.2)

What did you expect to happen?

Candle Charts working as they did until v3.2.0

What happened instead?

Candle charts are not drawing candles when compiled in swift 4.2. They work in swift 4.1 (v3.1.x) and in swift 3.2 (v3.0.x)

Compiled with swift 3.2 and swift 4.1:
img_0053

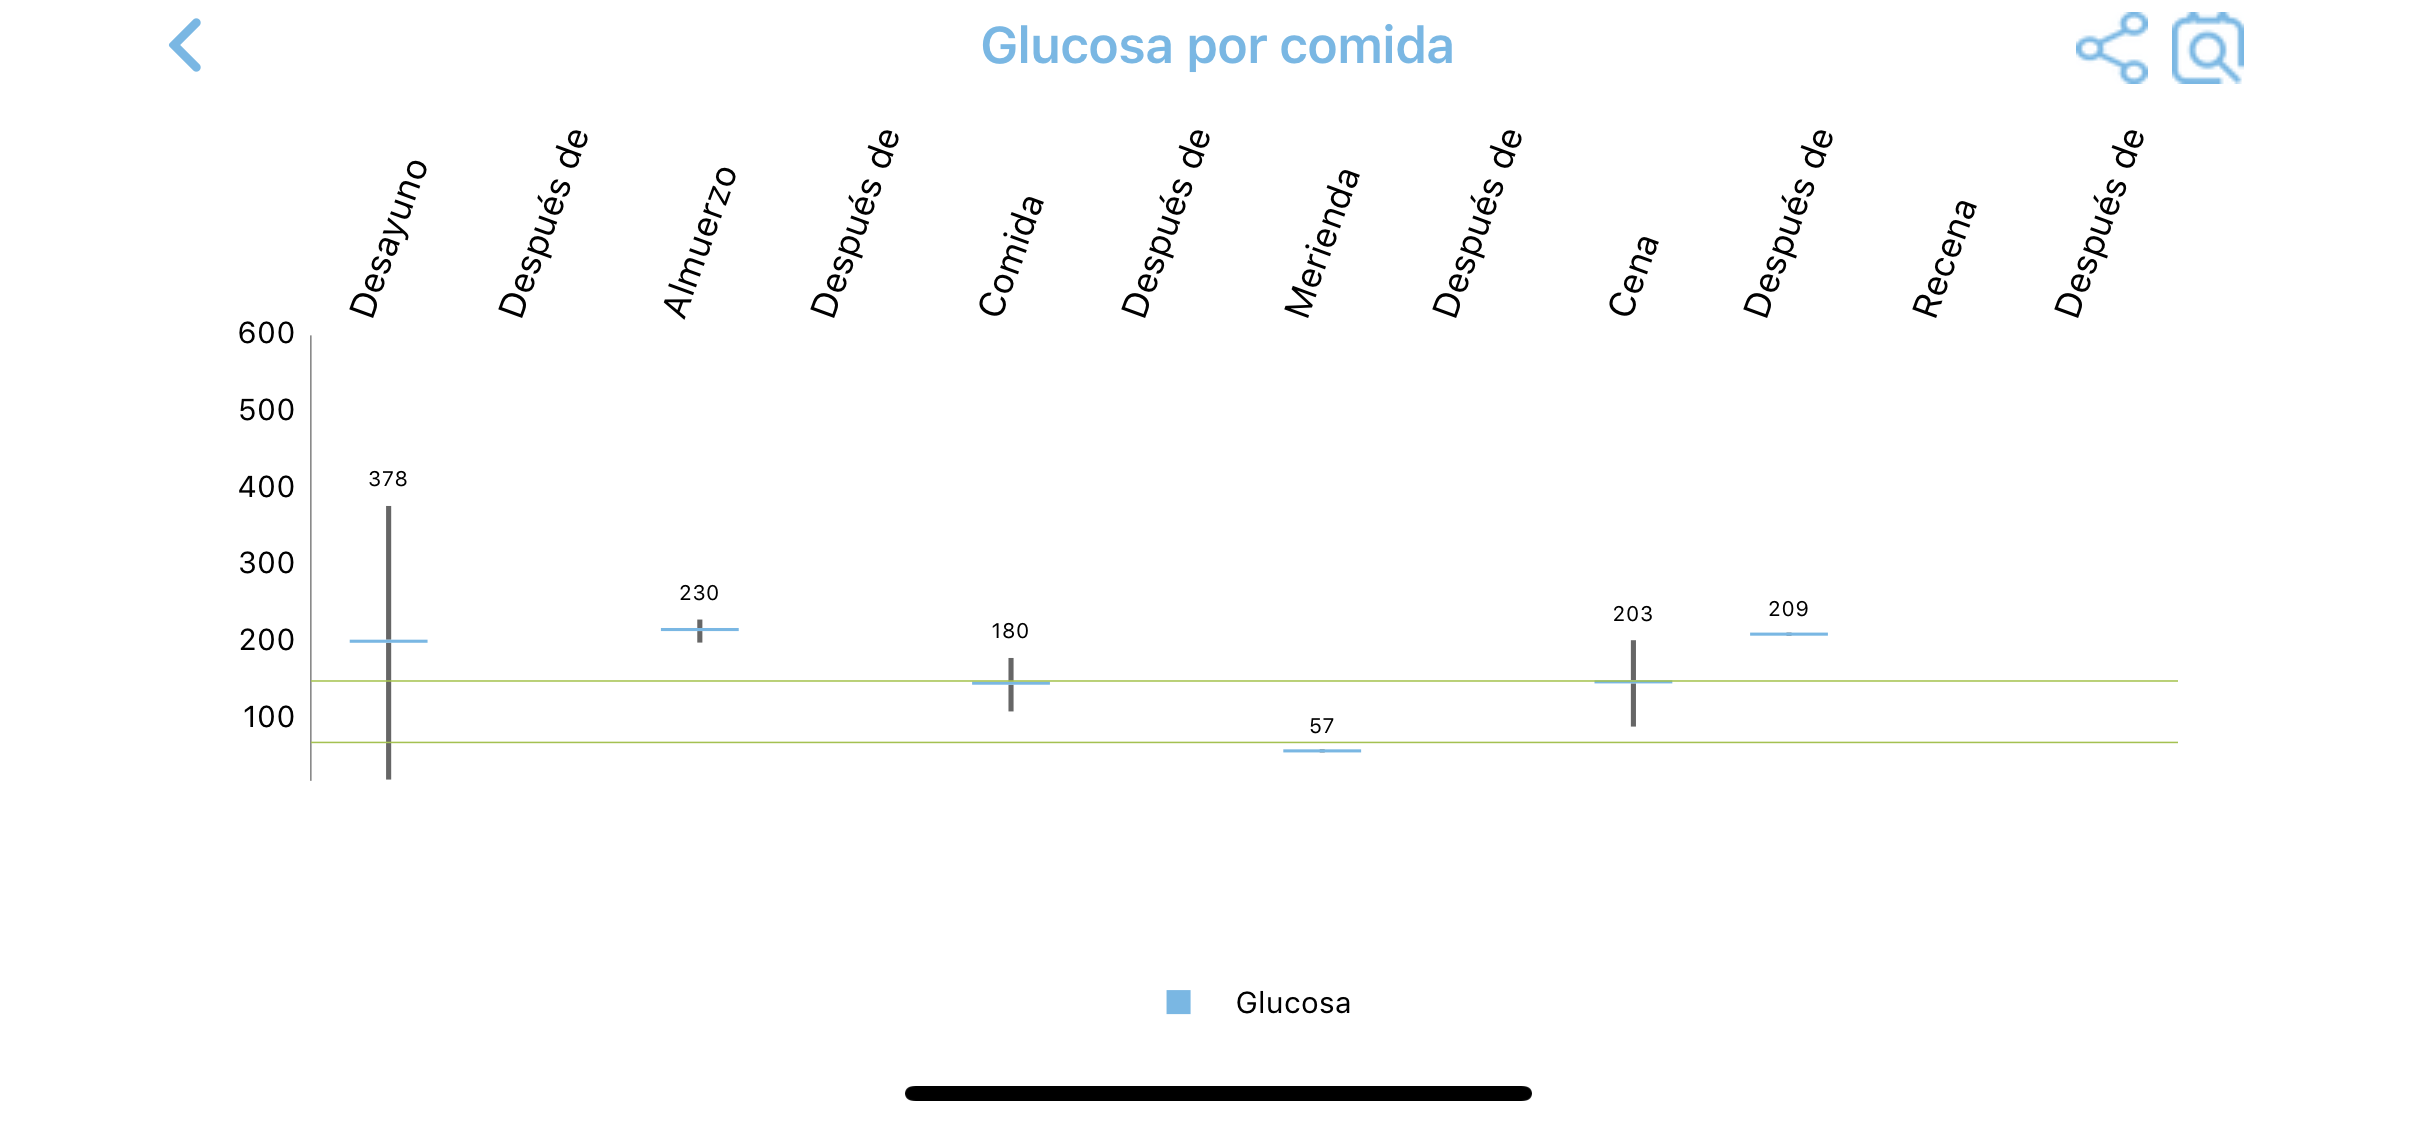
Compiled with swift 4.2:
img_0054

Charts Environment

Charts version/Branch/Commit Number: Master
**Xcode version:**10
**Swift version:**3.2 - 4.2
Platform(s) running Charts: iOS
macOS version running Xcode: 10.14

Demo Project

@liuxuan30
Copy link
Member

have you tried latest master and charts demo? is it combined chart?

@JFERSD
Copy link
Author

JFERSD commented Jan 16, 2019

Hi @liuxuan30 ,

Yeah, I forgot to mention it is a combined chart. Here is how I'm generating the chart in case it can help. Is the same code, just compiled in the different pod versions.

Thank you!

`

    var yValues: [CandleChartDataEntry] = []
    ...

    combinedChartView.xAxis.valueFormatter = mealsValueFormatter()
    combinedChartView.xAxis.labelFont = UIFont.preferredFont(forTextStyle: .caption1)
    combinedChartView.xAxis.labelRotationAngle = -70

    combinedChartView.legend.horizontalAlignment = .center
    combinedChartView.legend.verticalAlignment = .bottom
    combinedChartView.legend.drawInside = false
    combinedChartView.legend.formSize = 8.0
    combinedChartView.legend.formToTextSpace = 4.0
    combinedChartView.legend.xEntrySpace = 6.0
    combinedChartView.legend.enabled = true
    
    combinedChartView.rightAxis.enabled = false
    combinedChartView.leftAxis.enabled = true
    combinedChartView.leftAxis.setLabelCount(10, force: true)
    combinedChartView.leftAxis.drawAxisLineEnabled = true
    combinedChartView.leftAxis.drawZeroLineEnabled = false
    combinedChartView.leftAxis.drawGridLinesEnabled = false
    combinedChartView.leftAxis.labelCount = 10
    
    combinedChartView.rightAxis.enabled = false
    
    combinedChartView.leftAxis.axisMaximum = 600.0
    combinedChartView.leftAxis.axisMinimum = 20.0
    combinedChartView.leftAxis.granularity =  50

    combinedChartView.xAxis.granularity = 1.0
    combinedChartView.xAxis.drawLabelsEnabled = true

    let set1 = CandleChartDataSet(values: yValues, label: ...)
    set1.axisDependency = .left
    set1.setColor(...)
    set1.drawIconsEnabled = false
    set1.shadowColor = ...
    set1.shadowWidth = 1.7
    set1.decreasingColor = ...
    set1.decreasingFilled = true
    set1.increasingFilled = false
    set1.neutralColor = ...
    set1.barSpace = 0.25
    combinedChartView.rightAxis.enabled = false
    combinedChartView.xAxis.granularity = 1.0
    combinedChartView.xAxis.labelCount = 12
    combinedChartView.xAxis.drawLabelsEnabled = true
    combinedChartView.xAxis.drawAxisLineEnabled = false
    combinedChartView.xAxis.drawGridLinesEnabled = false
    
    let limitHighGlucose = ...
    let limitLowGlucose = ...
    
    let line1 = ChartLimitLine.init()
    line1.limit = Double(limitHighGlucose)
    line1.lineColor = ...
    line1.lineWidth = 0.5
    let line2 = ChartLimitLine.init()
    line2.lineColor = ...
    line2.limit = Double(limitLowGlucose)
    line2.lineWidth = 0.5
    
    combinedChartView.rightAxis.enabled = false
    combinedChartView.leftAxis.enabled = true
    combinedChartView.leftAxis.removeAllLimitLines()
    combinedChartView.leftAxis.addLimitLine(line1)
    combinedChartView.leftAxis.addLimitLine(line2)
    
    let combinedData = CombinedChartData()
    combinedData.candleData = CandleChartData.init(dataSet: set1)

    combinedChartView.chartDescription?.enabled = false

    combinedChartView.xAxis.spaceMin = 0.5
    combinedChartView.xAxis.spaceMax = 0.5
    
    combinedChartView.highlightPerDragEnabled = false

    combinedChartView.data = combinedData

`

@liuxuan30
Copy link
Member

I think it has been fixed with latest master.

@liuxuan30
Copy link
Member

I'm going to check a few PRs to see anything to merge and release a new version. Probably next week.

Sign up for free to join this conversation on GitHub. Already have an account? Sign in to comment
Labels
None yet
Projects
None yet
Development

No branches or pull requests

2 participants