Skip to content
New issue

Have a question about this project? Sign up for a free GitHub account to open an issue and contact its maintainers and the community.

By clicking “Sign up for GitHub”, you agree to our terms of service and privacy statement. We’ll occasionally send you account related emails.

Already on GitHub? Sign in to your account

Request Timeout after 30000ms occurred in 6.4 even though it didn't occur in 6.3.2 #22754

Closed
wyukawa opened this issue Sep 6, 2018 · 3 comments
Labels
bug Fixes for quality problems that affect the customer experience Feature:Visualizations Generic visualization features (in case no more specific feature label is available) Team:Visualizations Visualization editors, elastic-charts and infrastructure

Comments

@wyukawa
Copy link

wyukawa commented Sep 6, 2018

Kibana version:
6.4.0

Elasticsearch version:
6.4.0

Server OS version:
CentOS Linux release 7.4.1708 (Core)

Browser version:
Safari 11.1.2 (13605.3.8)

Browser OS version:
Mac 10.13.6

Original install method (e.g. download page, yum, from source, etc.):
yum

Describe the bug:
Request Timeout error occurred in dashboard.

Steps to reproduce:
1.
2.
3.

Expected behavior:

Screenshots (if relevant):
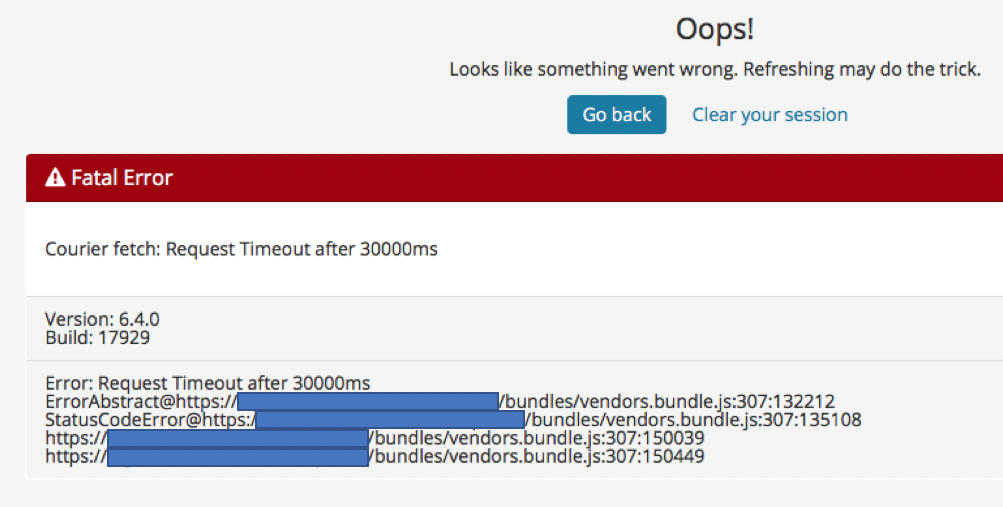
Errors in browser console (if relevant):

Provide logs and/or server output (if relevant):

Any additional context:
Our dashboard has 2 graph and auto refresh every 10s for last 4 hours data.
Request Timeout error didn't occur when we used kibana 6.3.2 but unfortunately error occurred in 6.4.
Same problem occurred in chrome 68.0.3440.106 but this frequency is less than safari.

@ppisljar
Copy link
Member

ppisljar commented Sep 6, 2018

can you please provide additional details:

  • visualization type
  • visualization config (best if you just export the saved object from management->saved objects)
  • (both visualizations and dashboard)
  • time range you are looking into

does it happen with short time ranges as well ? (like last 15 minutes)

@ppisljar ppisljar added bug Fixes for quality problems that affect the customer experience Feature:Visualizations Generic visualization features (in case no more specific feature label is available) labels Sep 6, 2018
@wyukawa
Copy link
Author

wyukawa commented Sep 7, 2018

Thank you fro relpy!

Our dashboard has 2 visualizations and visualization type is Line

Here is both visualizations and dashboard config

dashboard config

[
  {
    "_id": "c99c5090-66c3-11e7-acb8-ff97a07ea98f",
    "_type": "dashboard",
    "_source": {
      "title": "xxx_new_graph",
      "hits": 0,
      "description": "",
      "panelsJSON": "[{\"col\":1,\"id\":\"8992e1d0-66c3-11e7-acb8-ff97a07ea98f\",\"panelIndex\":1,\"row\":1,\"size_x\":12,\"size_y\":5,\"type\":\"visualization\"},{\"size_x\":12,\"size_y\":3,\"panelIndex\":2,\"type\":\"visualization\",\"id\":\"a99938d0-82fc-11e7-b7d4-4d67835ecfbd\",\"col\":1,\"row\":6}]",
      "optionsJSON": "{\"darkTheme\":false}",
      "uiStateJSON": "{}",
      "version": 1,
      "timeRestore": false,
      "kibanaSavedObjectMeta": {
        "searchSourceJSON": "{\"filter\":[{\"query\":{\"query_string\":{\"analyze_wildcard\":true,\"query\":\"*\"}}}],\"highlightAll\":true,\"version\":true}"
      }
    }
  }
]

visualization1 config

[
  {
    "_id": "8992e1d0-66c3-11e7-acb8-ff97a07ea98f",
    "_type": "visualization",
    "_source": {
      "title": "xxx_new_graph",
      "visState": "{\"title\":\"xxx_new_graph\",\"type\":\"line\",\"params\":{\"grid\":{\"categoryLines\":false,\"style\":{\"color\":\"#eee\"}},\"categoryAxes\":[{\"id\":\"CategoryAxis-1\",\"type\":\"category\",\"position\":\"bottom\",\"show\":true,\"style\":{},\"scale\":{\"type\":\"linear\"},\"labels\":{\"show\":true,\"truncate\":100},\"title\":{\"text\":\"@timestamp per minute\"}}],\"valueAxes\":[{\"id\":\"ValueAxis-1\",\"name\":\"LeftAxis-1\",\"type\":\"value\",\"position\":\"left\",\"show\":true,\"style\":{},\"scale\":{\"type\":\"linear\",\"mode\":\"normal\"},\"labels\":{\"show\":true,\"rotate\":0,\"filter\":false,\"truncate\":100},\"title\":{\"text\":\"Count\"}}],\"seriesParams\":[{\"show\":\"true\",\"type\":\"line\",\"mode\":\"normal\",\"data\":{\"label\":\"Count\",\"id\":\"1\"},\"valueAxis\":\"ValueAxis-1\",\"drawLinesBetweenPoints\":true,\"showCircles\":true}],\"addTooltip\":true,\"addLegend\":true,\"legendPosition\":\"right\",\"times\":[],\"addTimeMarker\":false},\"aggs\":[{\"id\":\"1\",\"enabled\":true,\"type\":\"count\",\"schema\":\"metric\",\"params\":{}},{\"id\":\"2\",\"enabled\":true,\"type\":\"date_histogram\",\"schema\":\"segment\",\"params\":{\"field\":\"@timestamp\",\"interval\":\"auto\",\"customInterval\":\"2h\",\"min_doc_count\":1,\"extended_bounds\":{}}},{\"id\":\"3\",\"enabled\":true,\"type\":\"terms\",\"schema\":\"group\",\"params\":{\"field\":\"content.extend.dimension4\",\"size\":20,\"order\":\"desc\",\"orderBy\":\"1\"}}],\"listeners\":{}}",
      "uiStateJSON": "{}",
      "description": "",
      "savedSearchId": "02eb9960-66c3-11e7-a5aa-73f0a025a29b",
      "version": 1,
      "kibanaSavedObjectMeta": {
        "searchSourceJSON": "{\"filter\":[]}"
      }
    }
  }
]

visualization2 config

[
  {
    "_id": "a99938d0-82fc-11e7-b7d4-4d67835ecfbd",
    "_type": "visualization",
    "_source": {
      "title": "xxx_total_graph",
      "visState": "{\"title\":\"xxx_total_graph\",\"type\":\"line\",\"params\":{\"grid\":{\"categoryLines\":false,\"style\":{\"color\":\"#eee\"}},\"categoryAxes\":[{\"id\":\"CategoryAxis-1\",\"type\":\"category\",\"position\":\"bottom\",\"show\":true,\"style\":{},\"scale\":{\"type\":\"linear\"},\"labels\":{\"show\":true,\"truncate\":100},\"title\":{\"text\":\"@timestamp per 5 minutes\"}}],\"valueAxes\":[{\"id\":\"ValueAxis-1\",\"name\":\"LeftAxis-1\",\"type\":\"value\",\"position\":\"left\",\"show\":true,\"style\":{},\"scale\":{\"type\":\"linear\",\"mode\":\"normal\"},\"labels\":{\"show\":true,\"rotate\":0,\"filter\":false,\"truncate\":100},\"title\":{\"text\":\"Count\"}}],\"seriesParams\":[{\"show\":\"true\",\"type\":\"line\",\"mode\":\"normal\",\"data\":{\"label\":\"Count\",\"id\":\"1\"},\"valueAxis\":\"ValueAxis-1\",\"drawLinesBetweenPoints\":true,\"showCircles\":true}],\"addTooltip\":true,\"addLegend\":true,\"legendPosition\":\"right\",\"times\":[],\"addTimeMarker\":false},\"aggs\":[{\"id\":\"1\",\"enabled\":true,\"type\":\"count\",\"schema\":\"metric\",\"params\":{}},{\"id\":\"2\",\"enabled\":true,\"type\":\"date_histogram\",\"schema\":\"segment\",\"params\":{\"field\":\"@timestamp\",\"interval\":\"auto\",\"customInterval\":\"2h\",\"min_doc_count\":1,\"extended_bounds\":{}}}],\"listeners\":{}}",
      "uiStateJSON": "{}",
      "description": "",
      "savedSearchId": "02eb9960-66c3-11e7-a5aa-73f0a025a29b",
      "version": 1,
      "kibanaSavedObjectMeta": {
        "searchSourceJSON": "{\"filter\":[]}"
      }
    }
  }
]

Current our time range is last 4 hours.

If time rage is last 15 minutes, same problem occurs in safari and chrome

@cjcenizal
Copy link
Contributor

@wyukawa Thanks for reporting this. This looks like a known regression which will be fixed in 6.4.1. Here's the PR with the fix: #22558. I'm going to close this issue but if you think that this bug is not the same bug referred to in that PR we can reopen it.

@timroes timroes added the Team:Visualizations Visualization editors, elastic-charts and infrastructure label Sep 13, 2018
Sign up for free to join this conversation on GitHub. Already have an account? Sign in to comment
Labels
bug Fixes for quality problems that affect the customer experience Feature:Visualizations Generic visualization features (in case no more specific feature label is available) Team:Visualizations Visualization editors, elastic-charts and infrastructure
Projects
None yet
Development

No branches or pull requests

4 participants