Name
双指标滤波交易策略Stochastic-Moving-Average-Strategy-with-Double-Filters
Author
ChaoZhang
Strategy Description
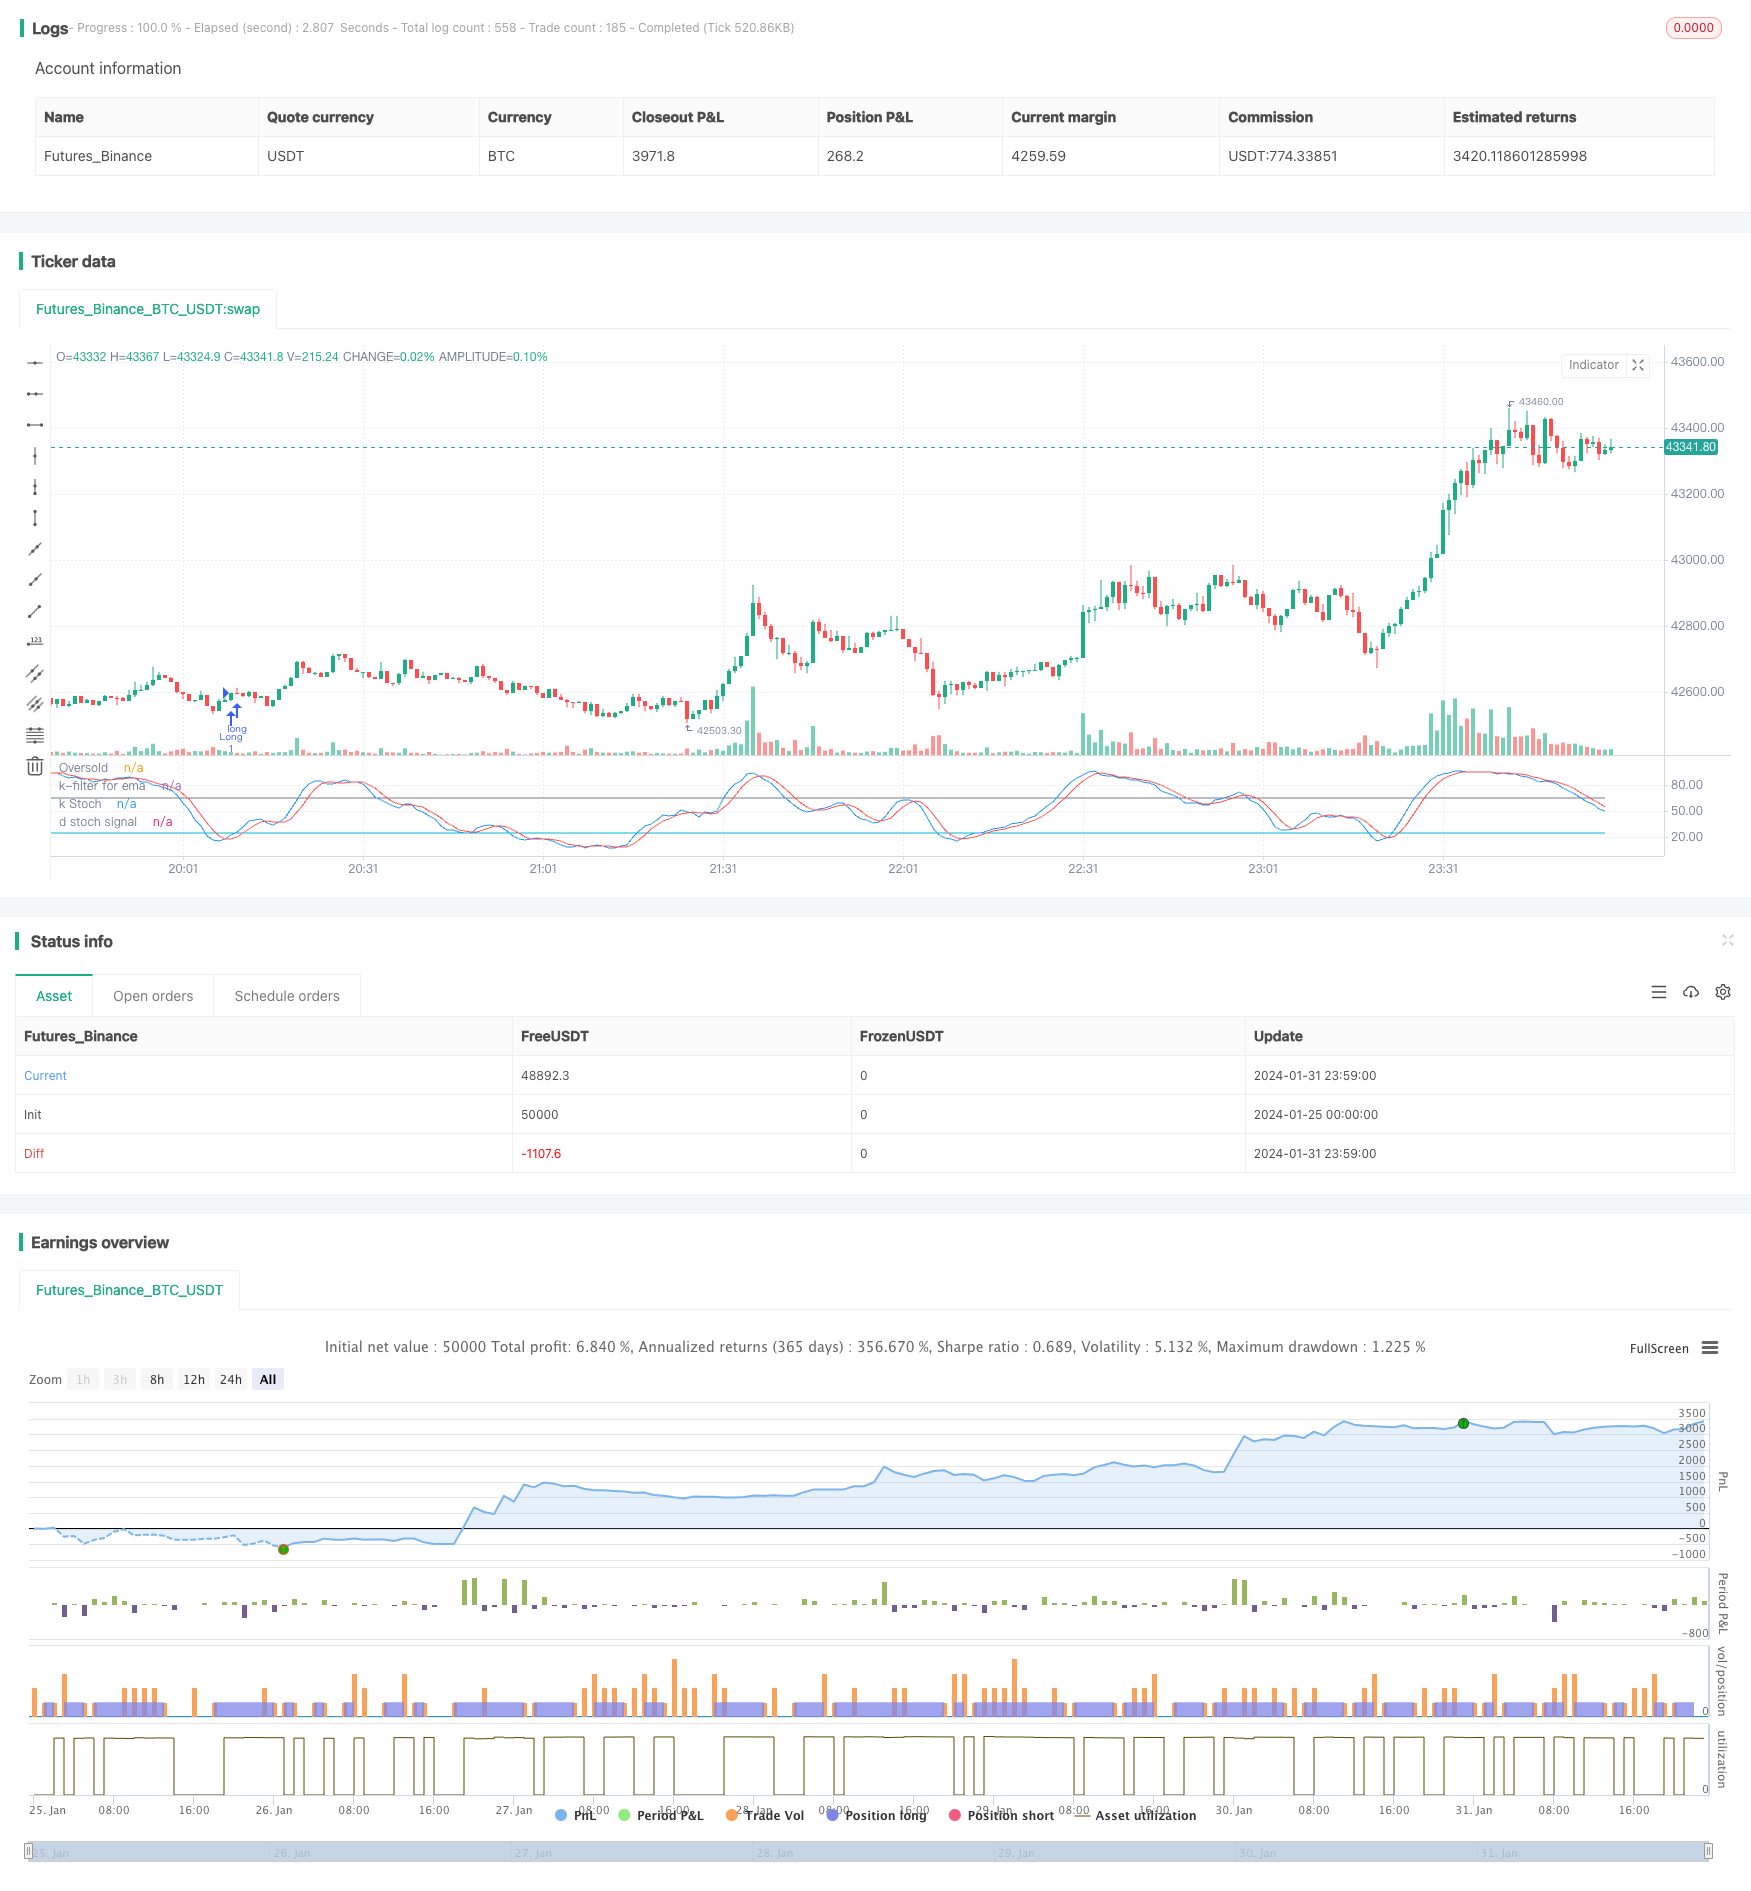
该策略是一个利用随机指标K值和指数移动平均线进行组合过滤的长线交易策略。策略在随机指标K值进入超卖区时判断符合买入条件,在价格跌破移动平均线且随机指标过滤条件成立时判断为止损或止盈平仓。
双指标滤波交易策略主要利用了随机指标K值判定买入时机和指数移动平均线判定止损止盈时机的技术指标特性。随机指标K值可以用来识别超卖超买情况,而移动平均线是判断价格趋势的工具。结合二者可以在超卖点买入,并利用移动平均线判定止损止盈时机。
该策略首先计算长度为21周期的随机指标K值和D值,以及长度为38周期的指数移动平均线。当K值上穿D值且进入超卖区(默认为25)时产生买入信号;当价格跌破移动平均线,且随机指标K值大于65的过滤阈值时,判断趋势反转,产生平仓信号;同时设置了13%的止损条件。
通过双指标和双过滤器进行交易,可以有效过滤假信号,在超卖区买入后跟踪长线趋势获利。该策略适合中长线持仓。
该策略具有以下几个优势:
-
利用随机指标Determine买点:随机指标K值穿越D值进入超卖区时,被视为股价反转信号,是比较好的买入时机。
-
双滤波器设计:策略同时利用K值/D值的金叉和价格低位过滤器确定买入时机,可以有效过滤假信号。
-
指数移动平均线跟踪止盈:指标具有滞后性,利用其进行止盈可以最大限度跟踪趋势获利。
-
随机指标再次过滤回调:在判断止盈平仓时,再次利用随机指标过滤普通回调和趋势反转,使策略更加稳定。
-
适合中长线持仓:通过双指标组合设计,策略适合中长线持仓,可以获得较好的盈利。
该策略也存在一些风险:
-
系统性风险:该策略对大市环境比较敏感,在熊市中容易亏损。
-
回调风险:在行情短期回调时,可能触发移动平均线止损而过早离场。
-
参数优化风险:指标参数需要反复测试优化,不当设置可能影响策略表现。
-
突发事件风险:重大突发消息面前,技术指标失效,需要注意避让这类时段。
该策略的一些可能的优化方向包括:
-
优化指标参数:反复测试不同参数组合,寻找最佳参数。
-
增加止损方法:可以引入波动率止损、追踪止损等方法。
-
结合其它指标:可再引入量能指标、布林带等判断买卖点。
-
优化移动平均线期数:测试更长期或更短期均线的效果。
-
分析大市环境:根据大盘行情状况动态调整策略参数。
双指标滤波交易策略整体来说是一个较完整的趋势跟踪策略。它利用随机指标确定买点,再用移动平均线跟踪趋势止盈,并设计了双重滤波器,可以有效过滤假信号。策略参数优化空间大,适合中长线持仓,是一种有效的股票交易策略。
||
This is a long-term trading strategy that combines the stochastic oscillator K values and exponential moving averages with double filters. It identifies buying opportunities when stochastic K crosses over D and enters oversold territory. The strategy generates sell signals when prices cross below the moving average and stochastic K is above a threshold, filtering normal throwbacks from trend reversals. Stop loss rules are also implemented.
The core idea of this strategy is to use stochastic K for timing entry signals, and exponential moving averages for booking profits. Stochastic oscillator is good at detecting overbought/oversold situations, while moving averages define the trend. By combining the two, entries are made at oversold levels, and profits are trailed along the trend using moving averages.
Specifically, this strategy calculates 21-period stochastic K and D values, as well as 38-period EMA. When K crosses above D into the oversold zone (default 25), a buy signal is generated. When prices cross below EMA and stochastic K is higher than the filter threshold (65), trend reversal is assumed and position is closed. A 13% stop loss rule is also implemented.
With double indicators and double filters, this strategy effectively filters out fake signals. Buying into oversold levels and trailing the uptrend can capture good profits. It is suitable for medium-to-long term holdings.
The main advantages of this strategy are:
-
Stochastic K determines good entry points when crossing into oversold territory.
-
Double filters of K/D cross and price extreme effectively avoid false signals.
-
Trailing take-profits with EMA makes full use of upside momentum.
-
Stochastic filters normal throwbacks from reversals when booking profits.
-
Suitable for medium-to-long term holdings with good profitability.
Some risks to consider:
-
Systemic risk - bear markets can cause heavy losses.
-
Throwback risk - temporary price pullbacks may prematurely trigger MA stop loss.
-
Parameter optimization risk - inappropriate parameter tuning affects performance.
-
Black swan risk - technical indicators fail against market shocks.
Some ways to optimize the strategy:
-
Optimize indicator parameters through rigorous backtesting.
-
Add other stop loss methods like volatility or trailing stop loss.
-
Incorporate other indicators like volume, Bollinger Bands etc.
-
Test shorter/longer moving average periods.
-
Dynamically adjust parameters based on market regimes.
This is an overall solid trend-following strategy. It uses stochastic to determine entry, moving average to trail exits, and implements double filters to avoid false signals. With ample parameter tuning flexibility, medium-to-long term holding and effectiveness in catching trends, this is an efficient stock trading strategy.
[/trans]
Strategy Arguments
| Argument | Default | Description |
|---|---|---|
| v_input_int_1 | 21 | period |
| v_input_int_2 | 13 | stop loss % |
| v_input_int_3 | true | leverage |
| v_input_1 | 2 | n days ago |
| v_input_int_4 | 65 | k filter for throwbacks |
| v_input_int_5 | 25 | Oversold value |
| v_input_int_6 | 6 | k |
| v_input_int_7 | 4 | d |
| v_input_int_8 | 38 | periodo Sma |
Source (PineScript)
/*backtest
start: 2024-01-25 00:00:00
end: 2024-02-01 00:00:00
period: 1m
basePeriod: 1m
exchanges: [{"eid":"Futures_Binance","currency":"BTC_USDT"}]
*/

//@version=5
// English version
strategy(title='Stochastic & MA',  overlay=false)
// INPUTS : all default value have already been optimized
length = input.int(21, 'period', minval=1)
lossp = input.int(13, 'stop loss %', minval=2, step=1)
leverage = input.int(1, 'leverage', minval=1, step=1)
// leverage has been introduced for modifying stop loss levels for financial instruments with leverage, like ETF
n = input(2, 'n days ago')
filtro = input.int(65, 'k filter for throwbacks', minval=20, step=1)
OverSold = input.int(25, 'Oversold value', minval=5, step=5)
// Building indicators
smoothK = input.int(6, 'k', minval=1)
smoothD = input.int(4, 'd', minval=1)
k = ta.sma(ta.stoch(close, high, low, length), smoothK)
d = ta.sma(k, smoothD)
//Empowerment: introducing EMA
sma_period = input.int(38, 'periodo Sma', minval=1)
emaf = ta.ema(close, sma_period)
//ENTRY condition and order
// First of all, it's better not trade shares with a quaterly loss or with a bad surprise towards to analysts' expectations or ipevaluated (P/E > 50), but on your choice
// You entry when Stochastic's K is higher than D in Oversold area (you may personalize), applying the condition that today's close should be higher than one of n-days ago (default of the day before yesterday or 2 candles ago)
entry1 = k > d and k <= OverSold and close >= close[n]
strategy.entry('Long', strategy.long, comment='k basso', when=entry1)
//EXIT CONDITIONS
//  1) close crosses under exponential movinig average with filter that k >= fixed level (65), in order to distinguish a violent movement of prices with a possibile beginning of a trend from an almost exhausted "ordinary" throwback
// 2) fixed stop loss on percentage
exit1 = ta.crossunder(close, emaf) and k >= filtro
losspel = strategy.position_avg_price * (1 - lossp / 100 * leverage)
exit2 = close < losspel
strategy.close('Long', when=exit1, comment='sma')
strategy.close('Long', when=exit2, comment='stop loss')
// plotting indicators (add Ema on your choice)
plot(k, color=color.new(color.blue, 0), linewidth=1, title='k Stoch')
plot(d, color=color.new(color.red, 0), linewidth=1, title='d stoch signal')
plot(OverSold, title='Oversold', color=color.new(color.aqua, 0))
plot(filtro, color=color.new(color.gray, 0), title='k-filter for ema')
Detail
https://www.fmz.com/strategy/440806
Last Modified
2024-02-02 11:28:58