Name
双EMA黄金交叉突破策略Dual-EMA-Golden-Cross-Breakout-Strategy
Author
ChaoZhang
Strategy Description
双EMA黄金交叉突破策略是一种基于双指数移动平均线(EMA)的趋势跟踪和突破交易策略。它通过计算两个不同周期的EMA,在它们发生黄金交叉时产生买入信号,在死亡交叉时产生卖出信号,以捕捉价格趋势的变化。此策略同时结合价格突破EMA的条件来发出信号,从而过滤假信号。
双EMA黄金交叉突破策略主要基于以下原理:
-
使用较短周期的EMA(26日线)来捕捉价格的短期趋势,使用较长周期的EMA(200日线)来判断长期趋势走向。
-
当短期EMA从下向上突破长期EMA时,称为“黄金交叉”,表示价格走势由跌转涨,产生买入信号。
-
当短期EMA从上向下突破长期EMA时,称为“死亡交叉”,表示价格走势由涨转跌,产生卖出信号。
-
交叉信号发出时,还需要价格同时突破EMA,以过滤假信号,确保交易信号的可靠性。
-
采用交易止损和止盈方法,以控制交易风险并锁定盈利。
双EMA黄金交叉突破策略具有以下优势:
-
使用双EMA判断价格趋势和交叉信号,可有效跟踪市场走势。
-
结合价格突破过滤信号,避免交叉假信号的误导。
-
采用简单明了的交易逻辑,容易理解和实现。
-
适用于不同品种和时间周期,灵活通用。
-
可配置EMA参数和止损止盈条件,适应性强。
双EMA黄金交叉突破策略也存在以下风险:
-
价格震荡时,EMA交叉可能频繁发生,产生过多交易信号。可适当调整EMA参数以减少交叉次数。
-
双EMA有时会产生滞后性,无法及时反应价格变化。可结合其他指标进行确认。
-
止损点过小容易被价格略微波动触发,止盈点过大可能错过部分盈利。需根据市场调整止损止盈位置。
-
交易信号产生前需判断大级别趋势,避免逆势交易。
双EMA黄金交叉突破策略可从以下几个方面进行优化:
-
应用机器学习算法动态优化EMA参数,使其能更好适应价格波动。
-
增加其他指标确认信号,如成交量、布林带等,提高信号质量。
-
结合深度学习预测价格路径,使止损止盈更接近最优位置。
-
针对高频数据进行策略优化,提高信号精准度。
-
增加自适应调整止损机制,防止过于频繁停损。
综上所述,双EMA黄金交叉突破策略利用EMA交叉信号判断价格走势和转折点,并加入价格突破过滤以避免假信号,是一种可靠、稳定、易于实现的趋势跟踪交易策略。通过参数优化、信号过滤和自适应调整可进一步增强策略的效果。其交易思路简单直观,适用于各类投资者,是量化交易的基础策略之一。
||
The dual EMA golden cross breakout strategy is a trend-following and breakout trading strategy based on two exponential moving averages (EMAs) with different periods. It generates buy signals when a golden cross between the two EMAs emerges and sell signals when a death cross happens, in order to capture trend changes in prices. This strategy also combines the price breakout condition of EMAs to filter out false signals.
The dual EMA golden cross breakout strategy is mainly based on the following logic:
-
Use a shorter period EMA (26-day line) to capture short-term trends and a longer period EMA (200-day line) to determine the long-term trend direction.
-
When the shorter period EMA crosses above the longer period EMA, it is called a “golden cross”, indicating the trend changes from downtrend to uptrend, and a buy signal is generated.
-
When the shorter period EMA crosses below the longer period EMA, it is called a “death cross”, indicating the trend changes from uptrend to downtrend, and a sell signal is generated.
-
When the cross signals occur, the price also needs to break through the EMAs to filter out false signals and ensure reliable trade signals.
-
Apply stop loss and take profit techniques to control trading risks and lock in profits.
The dual EMA golden cross breakout strategy has the following advantages:
-
Using dual EMAs to determine price trends and crossover signals can effectively track market movements.
-
Combining price breakout filter signals avoids being misled by false crossover signals.
-
Adopting simple and clear trading logic, easy to understand and implement.
-
Applicable to different products and time frames, flexible and versatile.
-
Configurable EMA parameters and stop loss/take profit conditions make it highly adaptable.
The dual EMA golden cross breakout strategy also has the following risks:
-
Frequent crossovers may occur when prices oscillate, generating excessive trading signals. Adjusting EMA parameters properly can reduce crossover frequency.
-
Dual EMAs sometimes have lagging performance and cannot respond to price changes in time. Other indicators can be combined for confirmation.
-
Stop loss points that are too small may be easily triggered by slight price fluctuations, while take profit points that are too large may miss some profits. Stop loss and take profit positions need to be adjusted according to market conditions.
-
Major trend judgments should be made before trade signals to avoid trading against the trend.
The dual EMA golden cross breakout strategy can be optimized in the following aspects:
-
Apply machine learning algorithms to dynamically optimize EMA parameters so that they can better adapt to price fluctuations.
-
Add other confirming signals like volume, Bollinger Bands etc. to improve signal quality.
-
Incorporate deep learning predictions of price paths to place stop loss and take profit closer to optimal levels.
-
Optimize strategies specifically for high frequency data to increase signal precision.
-
Add adaptive adjustment mechanisms for stop loss to prevent excessive stopping out.
In summary, the dual EMA golden cross breakout strategy utilizes EMA crossover signals to determine price trends and turning points, and incorporates price breakout filters to avoid false signals. It is a reliable, steady and easy-to-implement trend following trading strategy. Further enhancements can be made through parameter optimization, signal filtering and adaptive adjustment. Its trading logic is simple and intuitive, suitable for all kinds of investors, and thus is one of the fundamental algorithmic trading strategies.
[/trans]
Strategy Arguments
| Argument | Default | Description |
|---|---|---|
| v_input_1_close | 0 | src: close |
| v_input_2 | 26 | EMA-1 |
| v_input_3 | 200 | EMA-2 |
| v_input_4 | true | Show EMA ? |
| v_input_5 | 2 | Take Profit (%) |
| v_input_6 | true | Stop Loss (%) |
Source (PineScript)
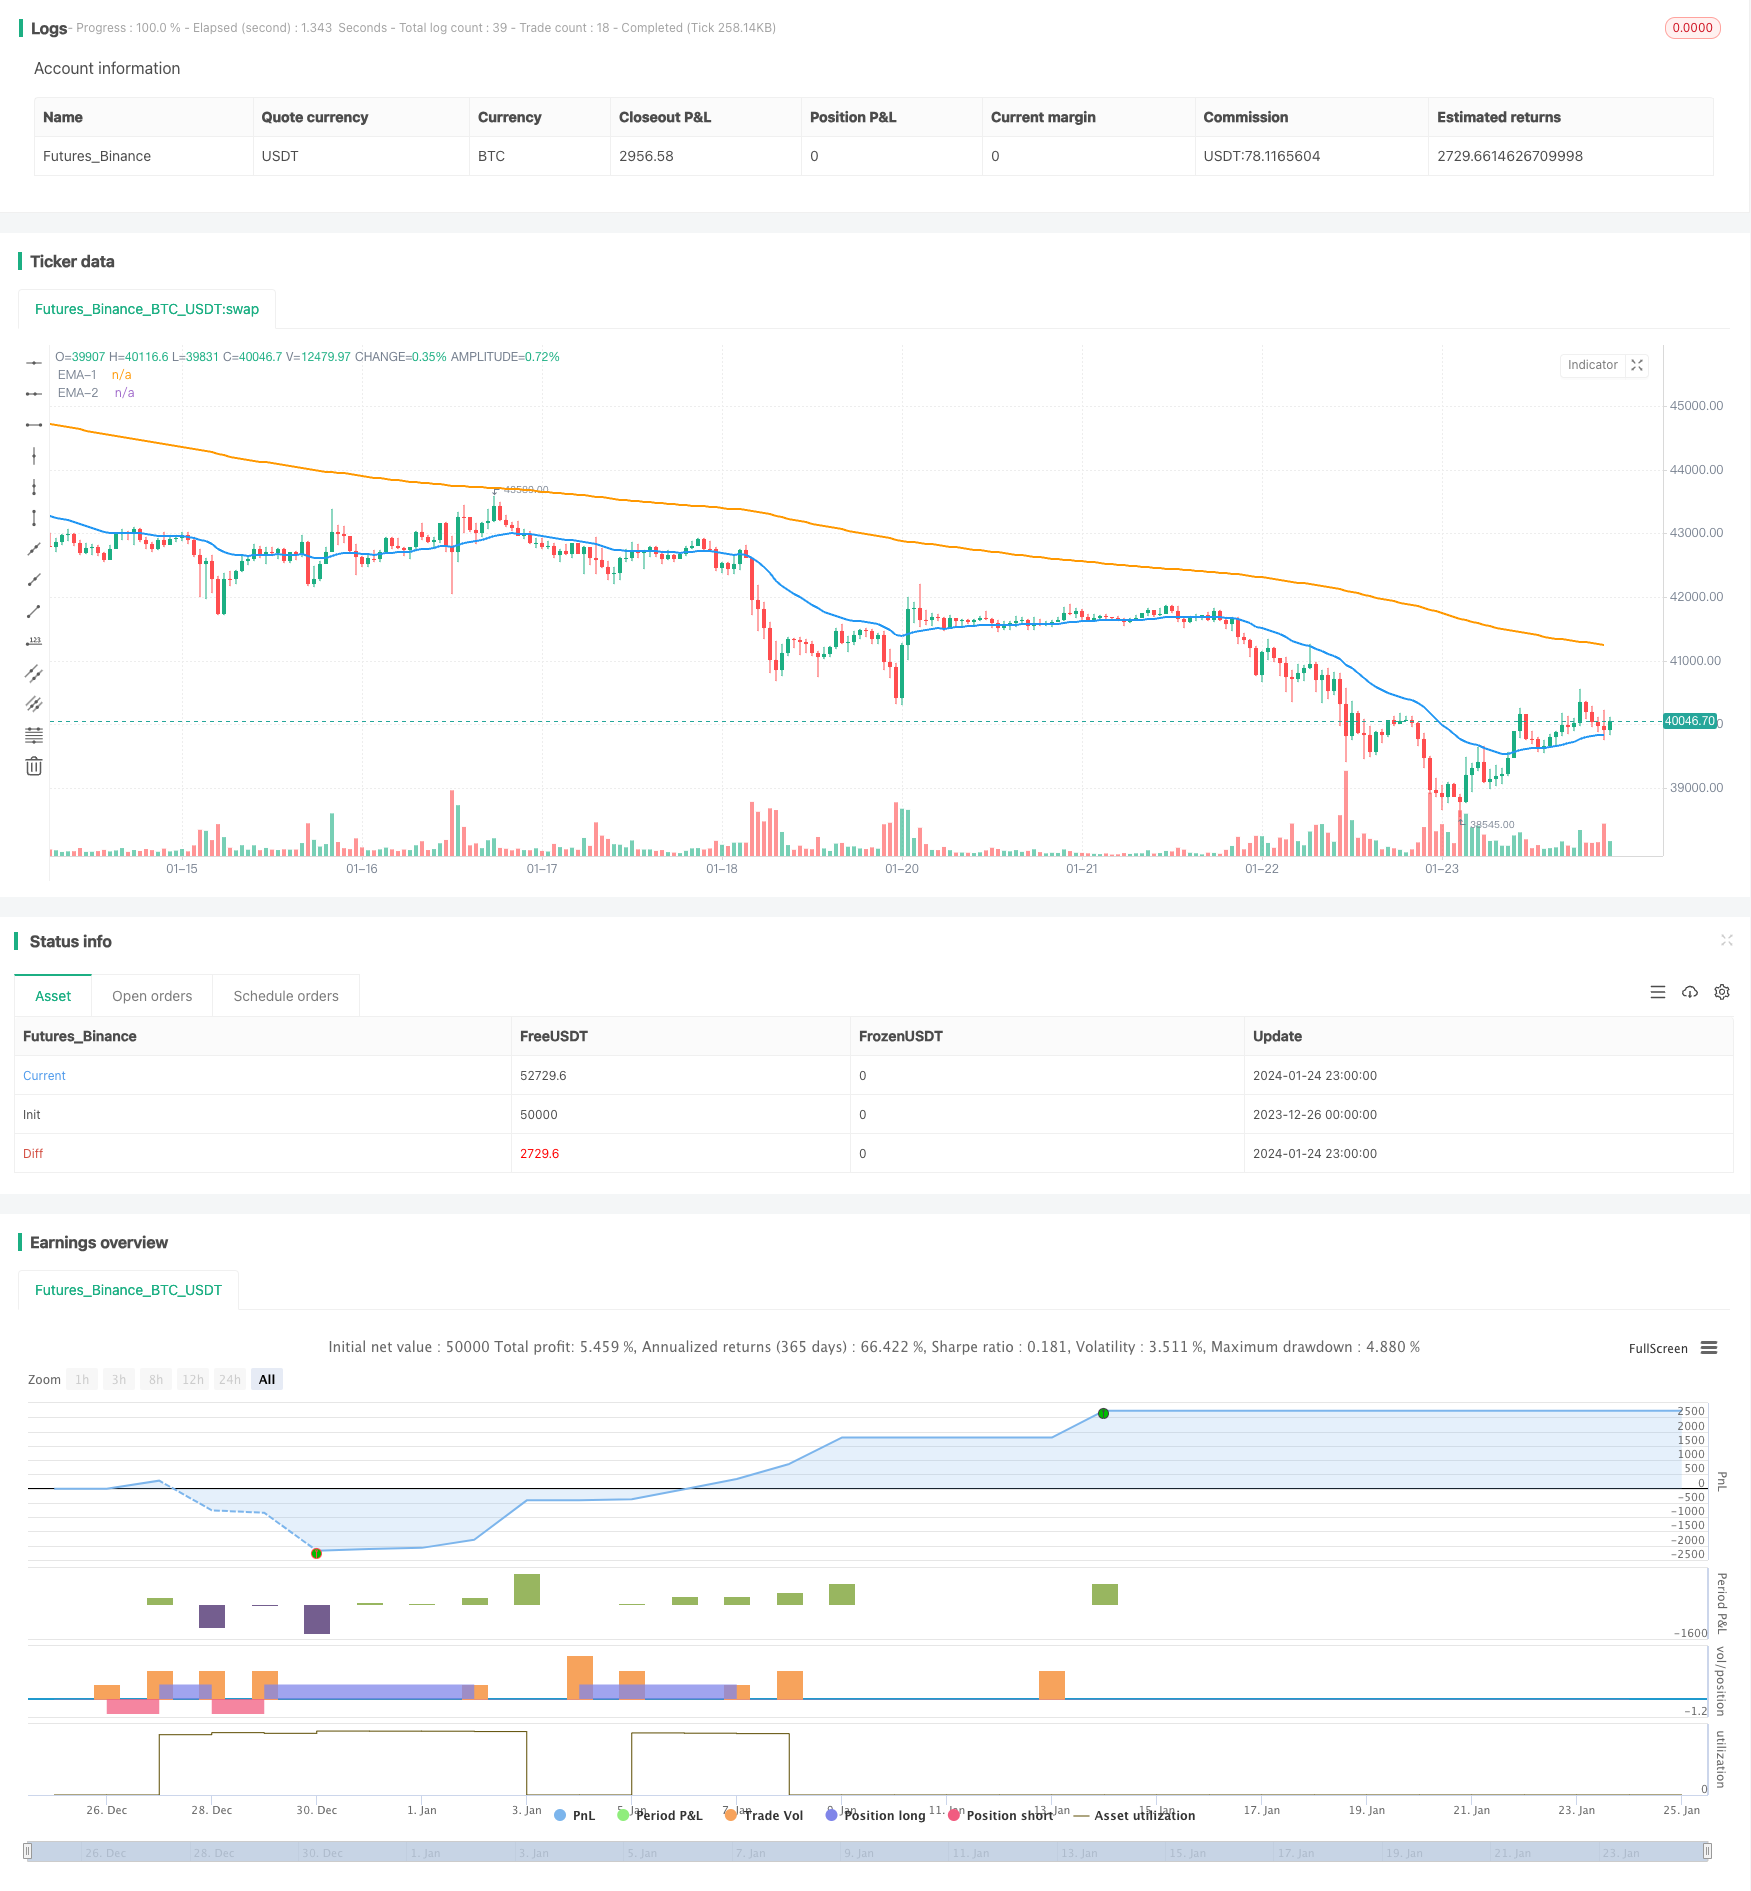
/*backtest
start: 2023-12-26 00:00:00
end: 2024-01-25 00:00:00
period: 1h
basePeriod: 15m
exchanges: [{"eid":"Futures_Binance","currency":"BTC_USDT"}]
*/

//@version=5
strategy("EMA Buy/Sell Signal", shorttitle="EMABuySell", overlay=true)

// === INPUTS ===
src = input(close)
ema1Length = input(26, title='EMA-1')
ema2Length = input(200, title='EMA-2')

EMASig = input(true, title="Show EMA ?")
takeProfitPercent = input(2.0, title="Take Profit (%)") / 100
stopLossPercent = input(1, title="Stop Loss (%)") / 100

pema1 = ta.ema(src, ema1Length)
pema2 = ta.ema(src, ema2Length)

// Plotting EMAs
plot(EMASig ? pema1 : na, title='EMA-1', color=color.new(color.blue, 0), linewidth=2)
plot(EMASig ? pema2 : na, title='EMA-2', color=color.new(color.orange, 0), linewidth=2)

// EMA Crossover Buy Signal
EMACrossoverLong = ta.crossover(pema1, pema2)

// EMA Crossunder Short Signal
EMACrossoverShort = ta.crossunder(pema1, pema2)

// Crossover above EMA-200 Long Signal
CrossoverAboveEMA200 = ta.crossover(close, pema2)

// Trading logic for Long
if ((EMACrossoverLong and close > pema1 and close > pema2) or CrossoverAboveEMA200)
    strategy.entry("Buy", strategy.long, qty=1)

// Take Profit logic for Long
longCondition = close >= strategy.position_avg_price * (1 + takeProfitPercent)
if (strategy.position_size > 0 and longCondition)
    strategy.close("Buy")

// Stop Loss logic for Long
stopLossConditionLong = ta.crossunder(pema1, pema2)
if (strategy.position_size > 0 and stopLossConditionLong)
    strategy.close("Buy")

// Trading logic for Short
if (EMACrossoverShort and close < pema1 and close < pema2)
    strategy.entry("Sell", strategy.short, qty=1)

// Take Profit logic for Short
shortCondition = close <= strategy.position_avg_price * (1 - takeProfitPercent)
if (strategy.position_size < 0 and shortCondition)
    strategy.close("Sell")

// Stop Loss logic for Short
stopLossConditionShort = ta.crossover(pema1, pema2)
if (strategy.position_size < 0 and stopLossConditionShort)
    strategy.close("Sell")

// Visual Signals
plotshape(series=EMACrossoverLong or CrossoverAboveEMA200, title="Buy Signal", color=color.green, style=shape.triangleup, size=size.small)
plotshape(series=EMACrossoverShort, title="Sell Signal", color=color.red, style=shape.triangledown, size=size.small)
Detail
https://www.fmz.com/strategy/440087
Last Modified
2024-01-26 15:13:59