Name
极化分形效率PFE交易策略Polarized-Fractal-Efficiency-PFE-Trading-Strategy
Author
ChaoZhang
Strategy Description
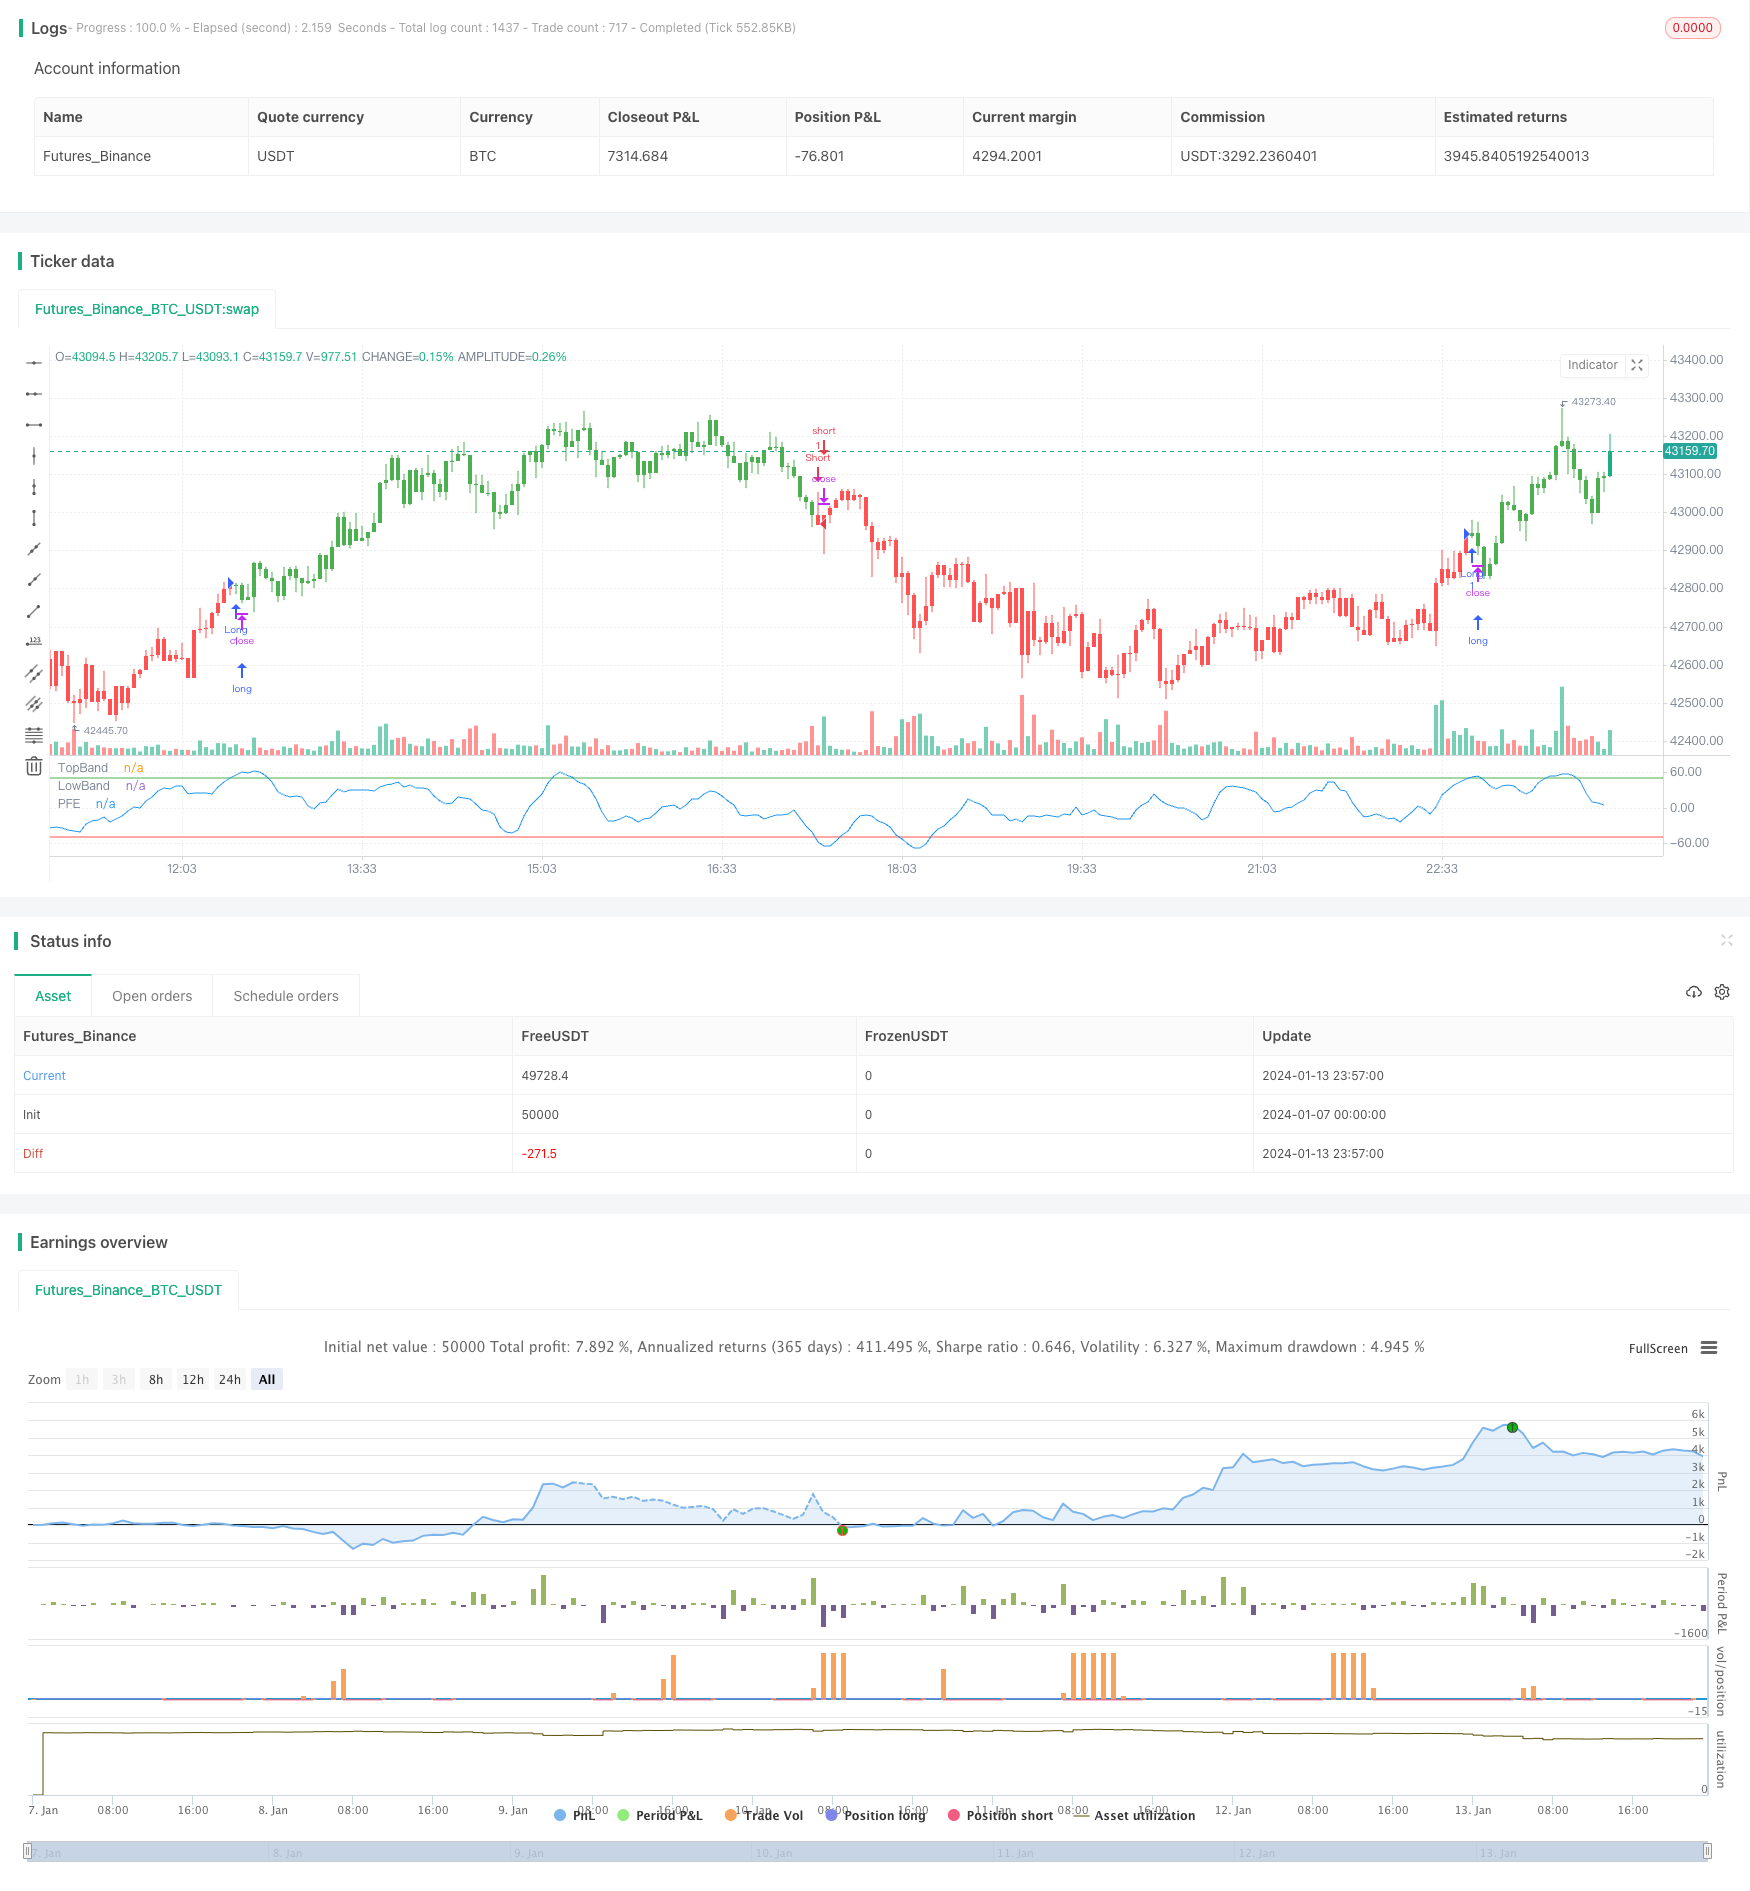
极化分形效率(Polarized Fractal Efficiency,PFE)交易策略通过应用分形几何和混沌理论的概念,测量价格运动的效率。价格运动越线性和高效,两个点之间的距离就越短,价格运动的效率也就越高。
PFE交易策略的核心指标是极化分形效率(PFE)。该指标基于下述公式计算:
PFE = sqrt(pow(close - close[Length], 2) + 100)
其中,Length为回看窗口期,该参数通过输入设置。PFE实际上是衡量价格在Length期间内运动的“长度”,它使用欧几里得距离(直线距离)来近似衡量。
为了评估价格运动的效率,我们需要一个用于对比的基准。这个基准是价格在Length期间内按照实际顺序连接而成路径的长度,称为C2C(Close to Close),计算公式如下:
C2C = sum(sqrt(pow((close - close[1]), 2) + 1), Length)
这样,我们就可以计算出价格运动的分形效率xFracEff:
xFracEff = iff(close - close[Length] > 0, round((PFE / C2C) * 100) , round(-(PFE / C2C) * 100))
如果价格上涨,分数为正值,如果下跌,则为负值。绝对值越大,表示运动越不效率。
为了产生交易信号,我们计算xEMA,即xFracEff的指数移动平均。并设定买入和卖出通道:
xEMA = ema(xFracEff, LengthEMA)

BuyBand = input(50)
SellBand = input(-50)
当xEMA上穿BuyBand generate买入信号;当xEMA下穿SellBand generate卖出信号。
PFE交易策略具有以下优势:
- 应用独特的分形几何和混沌理论方法,从另一个角度衡量价格运动效率
- 回避常规技术指标的一些问题,如曲线拟合
- 可以通过调整参数找到适合不同市场环境的设置
- 交易规则简单清晰,容易实施
PFE交易策略也存在以下风险:
- 和所有指标策略一样,参数优化困难,容易过度优化
- 在市场剧烈波动时,买卖信号可能不可靠
- 需谨慎处理极值,如价格突然出现间隙
- 需承受一定的时间滞后,产生信号时可能已经错过最佳入场点
PFE交易策略可以从以下几个方面进行优化:
- 尝试不同的Length参数组合,找到最佳平衡点
- 优化买卖通道参数,降低错误交易概率
- 加入止损机制,控制单笔损失
- 结合其它指标,提高信号质量
- 动态调整参数,适应市场环境变化
PFE交易策略立足于分形几何和混沌理论的角度,提出了一个新颖的方法来衡量价格运动的效率。相比常规技术指标,这种方法有其独特优势,但也面临一定程度的时间滞后,参数优化,信号质量方面的问题。通过不断测试与优化,PFE策略有望成为一个可靠的量化交易策略选择。
||
The Polarized Fractal Efficiency (PFE) trading strategy measures the efficiency of price movements by applying concepts from fractal geometry and chaos theory. The more linear and efficient the price movement, the shorter the distance prices travel between two points, and the higher the efficiency.
The core indicator of PFE trading strategy is Polarized Fractal Efficiency (PFE). It is calculated based on the following formula:
PFE = sqrt(pow(close - close[Length], 2) + 100)
Where Length is the lookback window, adjustable through input parameters. PFE essentially measures the "length" of price movement over the Length period, using Euclidean distance (straight-line distance) as an approximation.
To evaluate the efficiency of price movement, we need a benchmark for comparison. This benchmark is the length of the path connecting prices over Length period according to the actual sequence, called C2C (Close to Close), and is calculated as:
C2C = sum(sqrt(pow((close - close[1]), 2) + 1), Length)
Thus we can calculate fractal efficiency of price movement xFracEff:
xFracEff = iff(close - close[Length] > 0, round((PFE / C2C) * 100) , round(-(PFE / C2C) * 100))
Positive value when price rises and negative value when price falls. The larger the absolute number, the less efficient the movement.
To generate trading signals, we calculate the exponential moving average of xFracEff, called xEMA. Buy and sell bands are defined:
xEMA = ema(xFracEff, LengthEMA)

BuyBand = input(50)
SellBand = input(-50)
When xEMA crosses above BuyBand, it generates buy signal. When crossing below SellBand, it generates sell signal.
The PFE trading strategy has the following advantages:
- Applies unique concepts from fractal geometry and chaos theory to measure price movement efficiency from a different angle
- Avoids some problems of conventional technical indicators like curve fitting
- Parameters can be adjusted to find suitable settings for different market environments
- Simple and clear trading rules, easy to implement
The PFE trading strategy also has the following risks:
- Difficult parameter optimization, prone to overfitting like all indicator strategies
- Unreliable signals during extreme market turbulence
- Need to cautiously handle extremes like price gaps
- Bear some time lag, may have missed best entry point when signal triggers
The PFE strategy can be optimized from the following aspects:
- Try different combinations of Length parameter to find optimal balance
- Optimize buy and sell bands to reduce erroneous trades
- Add stop loss to control single trade loss size
- Combine other indicators to improve signal quality
- Dynamically adjust parameters to adapt to changing market environments
The PFE trading strategy proposes a novel approach based on fractal geometry and chaos theory concepts to measure the efficiency of price movements. Compared to conventional technical indicators, this method has its unique advantages but also faces problems like time lag, parameter optimization, signal quality to some extent. With continuous testing and optimization, PFE strategy shows promise to become a reliable quantitative trading strategy choice.
[/trans]
Strategy Arguments
| Argument | Default | Description |
|---|---|---|
| v_input_1 | 9 | Length |
| v_input_2 | 5 | LengthEMA |
| v_input_3 | 50 | BuyBand |
| v_input_4 | -50 | SellBand |
| v_input_5 | false | Trade reverse |
Source (PineScript)
/*backtest
start: 2024-01-07 00:00:00
end: 2024-01-14 00:00:00
period: 3m
basePeriod: 1m
exchanges: [{"eid":"Futures_Binance","currency":"BTC_USDT"}]
*/

//@version=2
////////////////////////////////////////////////////////////
//  Copyright by HPotter v1.0 29/09/2017
// The Polarized Fractal Efficiency (PFE) indicator measures the efficiency
// of price movements by drawing on concepts from fractal geometry and chaos
// theory. The more linear and efficient the price movement, the shorter the
// distance the prices must travel between two points and thus the more efficient
// the price movement.
//
// You can change long to short in the Input Settings
// WARNING:
// - For purpose educate only
// - This script to change bars colors.
////////////////////////////////////////////////////////////
strategy(title="PFE (Polarized Fractal Efficiency)", shorttitle="PFE (Polarized Fractal Efficiency)")
Length = input(9, minval=1)
LengthEMA = input(5, minval=1)
BuyBand = input(50, step = 0.1)
SellBand = input(-50, step = 0.1)
reverse = input(false, title="Trade reverse")
hline(BuyBand, color=green, linestyle=line, title = "TopBand")
hline(SellBand, color=red, linestyle=line, title = "LowBand")
PFE = sqrt(pow(close - close[Length], 2) + 100)
C2C = sum(sqrt(pow((close - close[1]), 2) + 1), Length)
xFracEff = iff(close - close[Length] > 0,  round((PFE / C2C) * 100) , round(-(PFE / C2C) * 100))
xEMA = ema(xFracEff, LengthEMA)
pos = iff(xEMA < SellBand, -1,
	   iff(xEMA > BuyBand, 1, nz(pos[1], 0)))
possig = iff(reverse and pos == 1, -1,
          iff(reverse and pos == -1, 1, pos))
if (possig == 1)
    strategy.entry("Long", strategy.long)
if (possig == -1)
    strategy.entry("Short", strategy.short)
barcolor(possig == -1 ? red: possig == 1 ? green : blue )
plot(xEMA, color=blue, title="PFE")
Detail
https://www.fmz.com/strategy/438792
Last Modified
2024-01-15 14:01:25