Name
理查德海龟交易策略Richards-Turtle-Trading-Strategy
Author
ChaoZhang
Strategy Description
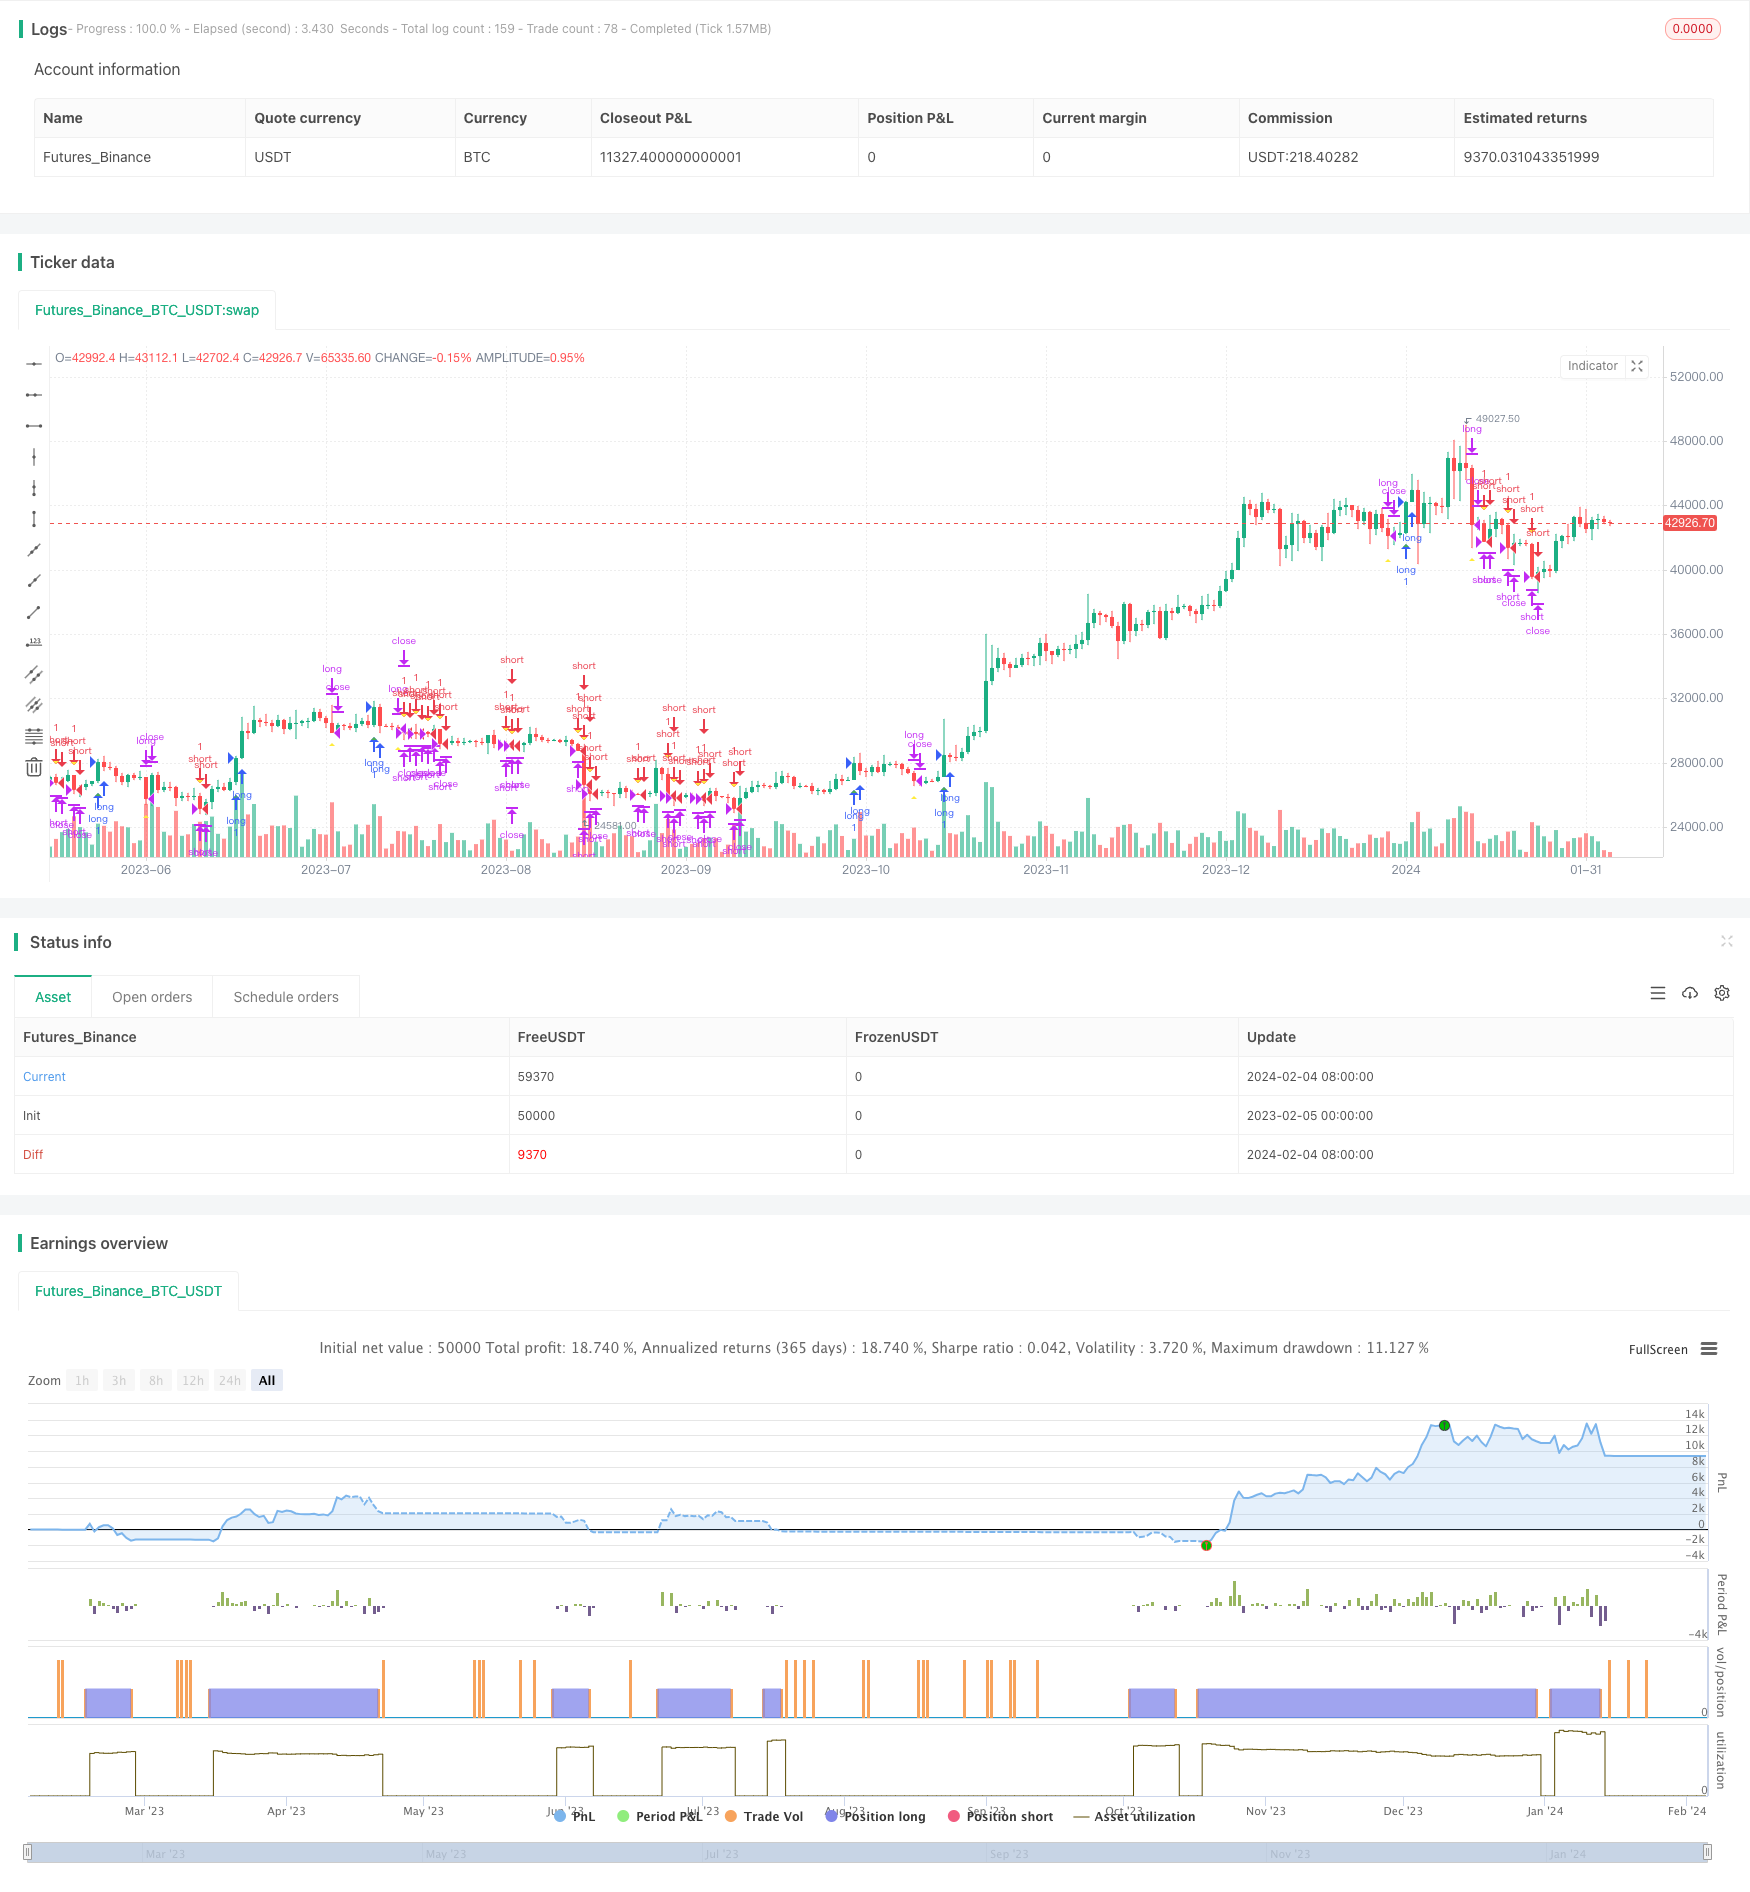
理查德海龟交易策略(Richard's Turtle Trading Strategy)是一个基于理查德·丹尼斯(Richard Dennis)海龟交易技术的买卖策略。该策略利用价格突破实现趋势追踪交易。当价格突破20日新高时做多,当价格突破20日新低时做空。
理查德海龟交易策略的核心逻辑是基于价格突破实现趋势追踪。具体来说,策略同时持续监控价格在20日内的最高值(_20_day_highest)和最低值(_20_day_lowest)。当当前收盘价超过20日最高值时,表明价格出现向上突破,此时发出做多信号。当当前收盘价低于20日最低值时,表明价格出现向下突破,此时发出做空信号。
进入仓位后,策略会利用平均真实波幅(ATR)来计算止损位。同时,也会跟踪10日最高价和最低价,进行滑点止损。当做多止损或滑点止损触发时平多仓;当做空止损或滑点止损触发时平空仓。
理查德海龟交易策略具有以下优势:
- 利用价格突破实现了趋势的自动跟踪。能够自动识别趋势转折,及时调整仓位。
- ATR止损机制,可以有效控制单笔止损。
- 滑点止损机制,可以锁定部分利润,降低回撤。
- 策略逻辑简单清晰,容易理解和实现,适合初学者学习。
- 无需预测市场走势和COMPLEX计算,简单规则式交易。
理查德海龟交易策略也存在一些风险:
- 突破交易容易被套,有时会产生过多交易频率。
- ATR和滑点止损过于严格,可能会过早止损。
- 仅利用价格信息,没有结合其他因素预测趋势持续性。
- 回测数据拟合风险,实盘效果可能不佳。
为了降低这些风险,可以考虑优化入场条件,利用更多指标预测趋势;调整止损算法,降低止损频率。
理查德海龟交易策略可以从以下几个方向进行优化:
- 优化参数,寻找最优参数组合。可以调整计算周期,或者测试不同的ATR倍数。
- 利用更多指标或机器学习算法判断趋势。可以结合均线、能量类指标等判断趋势持续性。
- 优化止损方式。可以测试灵活滑点止损、跟踪止损等方式。
- 结合情绪指标、消息面等更多信息预测市场走势。这可以过滤掉一些假突破。
理查德海龟交易策略是一个非常典型的突破追踪策略。它简单易行,适合初学者学习,也是量化交易的一个典范。该策略可以通过多方面优化,降低交易风险,提高盈利空间。总的来说,理查德海龟策略具有很强的启发意义。
||
Richard's Turtle Trading Strategy is a trading strategy based on Richard Dennis's turtle trading techniques. It utilizes price breakouts to track trends. It goes long when price breaks through 20-day high and goes short when price breaks through 20-day low.
The core logic of Richard's turtle trading strategy is to track trends based on price breakouts. Specifically, the strategy continuously monitors the highest (_20_day_highest) and lowest (_20_day_lowest) prices in the last 20 days. When the closing price breaks through 20-day high, it signals an upward breakthrough, triggering long order. When the closing price falls below 20-day low, it signals a downward breakthrough, triggering short order.
After entering positions, the strategy uses Average True Range (ATR) to calculate stop loss price. It also tracks 10-day high and low prices for slippage stop loss. When long stop loss or slippage stop loss is triggered, it will close long position. When short stop loss or slippage stop loss is triggered, it will close short position.
Richard's turtle trading strategy has the following advantages:
- It automatically tracks trends using price breakouts. It can automatically identify trend reversals and adjust positions accordingly.
- ATR stop loss mechanism effectively controls single stop loss.
- Slippage stop loss mechanism locks in some profits and reduces drawdowns.
- The strategy logic is simple and easy to understand for beginners.
- No need to predict market trends or complex calculations, just simple rule-based trading.
There are also some risks with Richard's turtle trading strategy:
- Breakout trading is prone to being trapped, sometimes generating excessive trading frequency.
- ATR and slippage stop loss may be too strict, causing premature stop loss occasionally.
- It only utilizes price data without combining other factors to predict trend continuity.
- Backtest overfit risk, real trading results may be poor.
To mitigate these risks, we can optimize entry conditions with more indicators to predict trends; adjust stop loss algorithms to reduce stop loss frequency.
Richard's turtle trading strategy can be optimized in the following aspects:
- Optimize parameters to find optimum parameter combinations, such as adjusting calculation cycle or testing different ATR multiples.
- Incorporate more indicators or machine learning algorithms to judge trend continuity, such as moving averages, momentum indicators etc.
- Optimize stop loss methods, such as testing flexible slippage stop loss, trailing stop loss etc.
- Combine sentiment indicators, news and more information to predict market movements. This can filter out some false breakouts.
Richard's turtle trading strategy is a very typical breakout trend following strategy. It is simple and practical, good for beginners to learn, and a quant trading paradigm. The strategy can be optimized in many ways to reduce risks and increase profitability. Overall, Richard's turtle strategy is very enlightening.
[/trans]
Strategy Arguments
| Argument | Default | Description |
|---|---|---|
| v_input_1 | 4 | stop loss var |
| v_input_2 | 20 | lenght |
Source (PineScript)
/*backtest
start: 2023-02-05 00:00:00
end: 2024-02-05 00:00:00
period: 1d
basePeriod: 1h
exchanges: [{"eid":"Futures_Binance","currency":"BTC_USDT"}]
*/

// This source code is subject to the terms of the Mozilla Public License 2.0 at https://mozilla.org/MPL/2.0/
// © melodyera0822

//@version=4
strategy("Richard Strategy", overlay=true)

// User input
variable_for_stoploss = input(4,title="stop loss var")
lenght = input(20,title="lenght")

// high_low
_20_day_highest = highest(nz(close[1]), lenght)
_20_day_lowest = lowest(nz(close[1]), lenght)

_10_day_low = lowest(nz(close[1]), lenght/2)
_10_day_high = highest(nz(close[1]), lenght/2)

//indicators
atr20 = atr(20)
ema_atr20 = ema(atr20,20)

//vars
var traded = "false"
var buy_sell = "none"
var buyExit = false
var sellExit = false
var stoploss = 0

buyCon = close > _20_day_highest and traded == "false"
plotshape(buyCon,style = shape.triangleup,location = location.belowbar, color = color.green )
if (buyCon)
    strategy.entry("long", strategy.long, when = buyCon)
    traded := "true"
    buy_sell := "buy"
    stoploss := round(close - variable_for_stoploss * ema_atr20)

sellCon = close < _20_day_lowest and  traded == "false"
plotshape(sellCon,style = shape.triangledown, color = color.red )
if (sellCon)
    strategy.entry("short", strategy.short)
    traded := "true"
    buy_sell := "sell"
    stoploss := round(close - variable_for_stoploss * ema_atr20)

if traded == "true"
    if buy_sell == "buy" and ((close<stoploss)or(close<_10_day_low))
        strategy.close("long")
        buyExit := true
        traded := "false"

    if buy_sell == "sell" and ((close>stoploss)or(close>_10_day_high))
        strategy.close("short")
        sellExit := true
        traded := "false"

plotshape(buyExit,style = shape.triangleup,location = location.belowbar, color = color.yellow )
buyExit := false
plotshape(sellExit,style = shape.triangledown, color = color.yellow )
sellExit := false
Detail
https://www.fmz.com/strategy/441160
Last Modified
2024-02-06 11:56:47