Name
StochRSI反转交易策略StochRSI-Reversal-Trading-Strategy
Author
ChaoZhang
Strategy Description
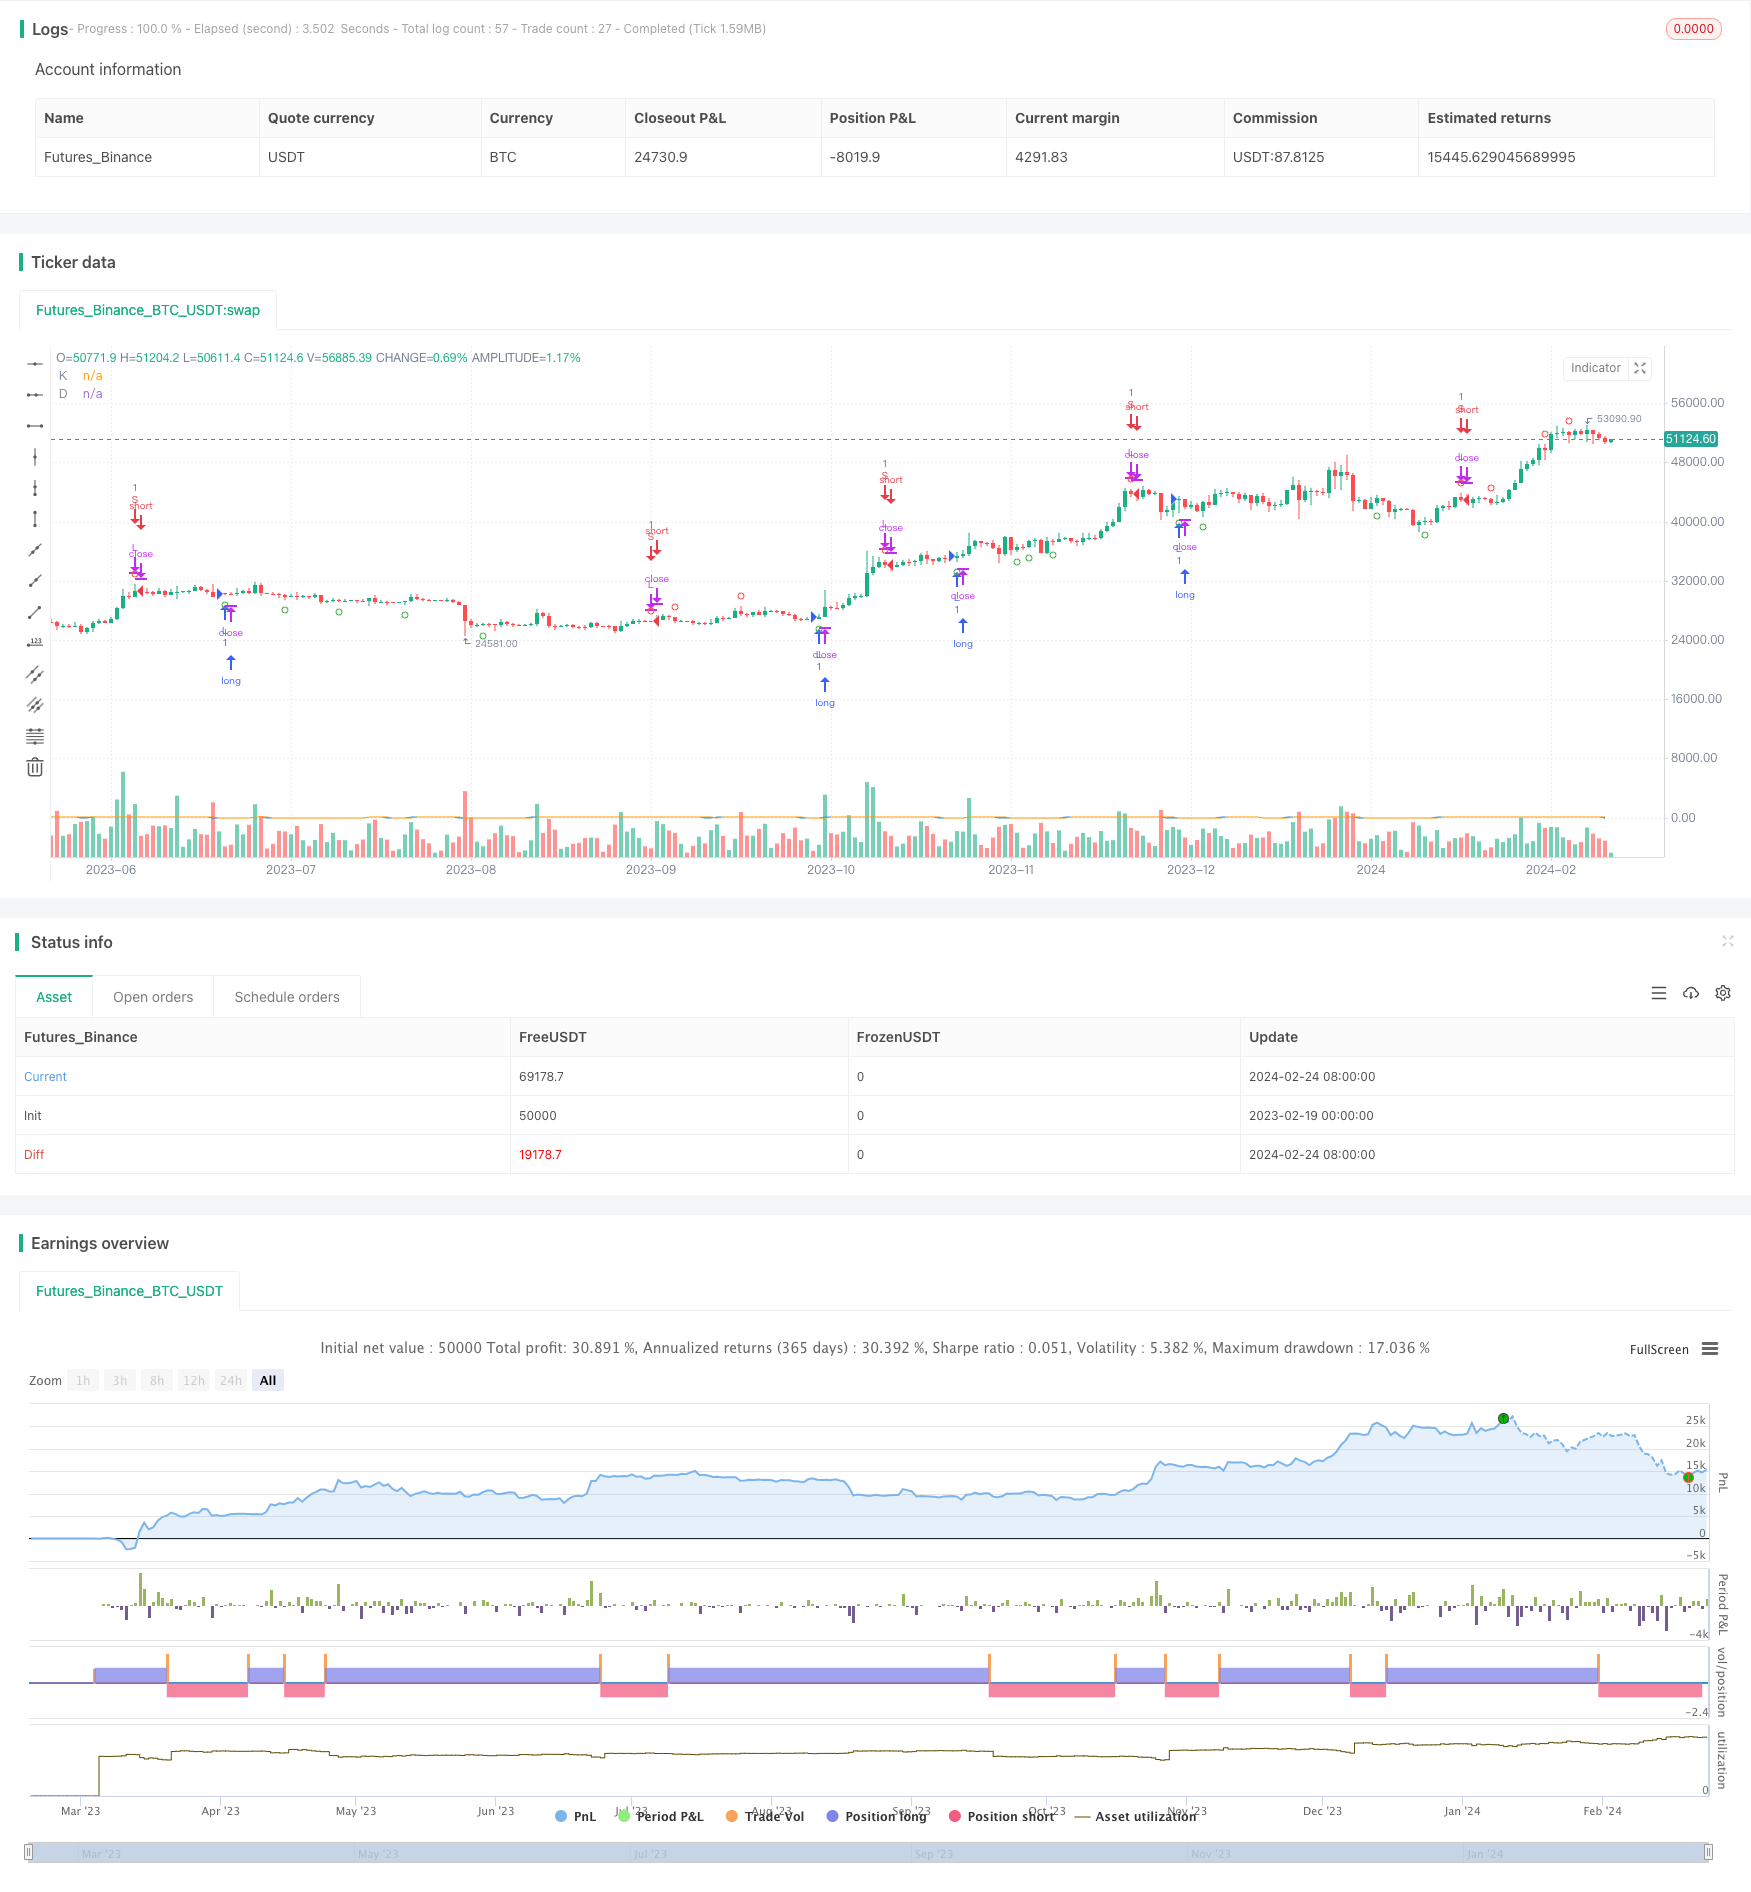
StochRSI反转交易策略是一种联合使用Stochastic RSI和RSI指标的量化交易策略。该策略通过Stochastic RSI指标识别超买超卖情况,在RSI指标反转的时候产生交易信号。
该策略首先计算14日RSI指标。然后基于RSI指标计算Stochastic RSI,包括%K线和%D线。其中%K线参数为3日SMA,%D线参数为%K线的3日SMA。当%K线从超卖区域进入另一极端区域且上穿%D线时,产生买入信号;当%K线从超卖区域进入另一极端区域且下穿%D线时,产生卖出信号。
这种策略联合使用Stochastic RSI和RSI指标,可以更准确地捕捉反转点位。相比单一RSI指标,有以下优势:
-
Stochastic RSI可以更清楚地识别超买超卖现象,滤除部分噪音。
-
Stochastic RSI结合RSI指标反转,可以更准确抓住反转的时机点。
-
通过调整Stochastic RSI的参数,可以优化指标灵敏度,适应更多市场环境。
该策略也存在一些风险:
-
反转失败风险。所选指标不能完全准确预测价格反转,仍存在一定失败风险。
-
参数优化风险。Stochastic RSI和RSI的参数设置会影响策略表现,需要进行优化。
-
趋势市场表现较弱。在趋势突破市场中,跟随趋势的策略通常优于反转策略。
对策:
-
适当调整止损点,控制单笔损失。
-
借助机器学习寻找最优参数组合。
-
结合趋势跟随策略,在不同市场中灵活切换。
该策略还可以从以下方向进行优化:
-
优化Stochastic RSI和RSI的参数,找到最佳组合。可以借助机器学习训练这些参数。
-
增加止损策略,如策略亏损超过3%就止损。这可以有效控制风险。
-
结合动量因子,在超买超卖的同时判定价格动量,避免假突破。
-
增加趋势判断,当处于趋势市场时停止反转交易,改为跟踪趋势。
StochRSI反转交易策略通过联合Stochastic RSI和RSI指标判断超买超卖现象,在价格反转时入场,目的是捕捉中短线随机震荡获利。这种策略可以提高反转交易精确度,但也存在一定失败风险。我们可以通过参数优化、止损策略、动量判定等方式进一步完善该策略,在保持较高胜率的同时控制风险。
||
The StochRSI reversal trading strategy is a quantitative trading strategy that combines the Stochastic RSI and RSI indicators. This strategy identifies overbought and oversold situations using the Stochastic RSI indicator and generates trading signals when the RSI indicator reverses.
The strategy first calculates the 14-day RSI indicator. Then it computes the Stochastic RSI based on the RSI, including the %K line and %D line. The %K line uses a 3-day SMA parameter, and the %D line uses a 3-day SMA of the %K line. When the %K line crosses above the %D line after falling from the overbought zone to the oversold zone, a buy signal is generated. When the %K line crosses below the %D line after rising from the oversold zone to the overbought zone, a sell signal is generated.
By combining the Stochastic RSI and RSI indicators, this strategy can capture reversal points more precisely. Compared to a single RSI indicator, it has the following advantages:
-
Stochastic RSI can identify overbought and oversold conditions more clearly and filter out some noise.
-
Stochastic RSI combined with RSI reversals can capture the timing of reversals more accurately.
-
By tuning the Stochastic RSI parameters, the sensitivity of the indicator can be optimized to suit more market environments.
The strategy also contains some risks:
-
Reversal failure risk. The selected indicators cannot perfectly predict price reversals, so there is always a risk of failures.
-
Parameter optimization risk. The parameters of Stochastic RSI and RSI affect the strategy performance and need to be optimized.
-
Weaker performance in trending markets. Trend-following strategies typically outperform reversal strategies in trending breakout markets.
Countermeasures:
-
Adjust the stop loss appropriately to control single trade loss.
-
Search for the optimal parameter combinations using machine learning.
-
Combine with trend-following strategies and switch between them flexibly based on market conditions.
The strategy can also be improved in the following aspects:
-
Optimize the parameters of Stochastic RSI and RSI to find the best combination, possibly through machine learning.
-
Add stop loss logic, like exiting when the strategy is down 3% to effectively control risks.
-
Combine momentum factors, identify excess momentum when overbought/oversold to avoid false breakouts.
-
Add trend determination - stop reversal trading and start trend tracking when in trending markets.
The StochRSI reversal trading strategy enters trades upon the identification of overbought/oversold conditions using the combination of Stochastic RSI and RSI, aiming to capture profits from short-to-medium term random oscillations. While the strategy can improve the accuracy of reversal trading, risks like reversal failures still exist. We can further enhance the strategy by optimizing parameters, adding stop loss, determining momentum and so on to maintain higher win rates while controlling risks.
[/trans]
Strategy Arguments
| Argument | Default | Description |
|---|---|---|
| v_input_1 | 3 | %K |
| v_input_2 | 3 | %D |
| v_input_3 | 14 | RSI Length |
| v_input_4 | 14 | Stoch Length |
| v_input_5 | 80 | Overbought Level |
| v_input_6 | 20 | Oversold Level |
Source (PineScript)
/*backtest
start: 2023-02-19 00:00:00
end: 2024-02-25 00:00:00
period: 1d
basePeriod: 1h
exchanges: [{"eid":"Futures_Binance","currency":"BTC_USDT"}]
*/

//@version=4
strategy("StochRSIStrategy", overlay=true)

// Define the K and D periods, RSI length, and overbought/oversold levels
K = input(3, title="%K")
D = input(3, title="%D")
rsiLength = input(14, title="RSI Length")
stochLength = input(14, title="Stoch Length")
overbought = input(80, title="Overbought Level")
oversold = input(20, title="Oversold Level")

// Calculate the RSI
rsi = rsi(close, rsiLength)

// Calculate Stochastic RSI
stochRsi = stoch(rsi, rsi, rsi, stochLength)
Kline = sma(stochRsi, K)
Dline = sma(Kline, D)

// Plot Stochastic RSI
plot(Kline, title="K", color=color.blue)
plot(Dline, title="D", color=color.orange)

// Define bullish and bearish conditions
bullCond = (Kline < oversold) and (crossover(Kline, Dline))
bearCond = (Kline > overbought) and (crossunder(Kline, Dline))

// Generate and plot signals
if (bullCond)
    strategy.entry("L", strategy.long)
if (bearCond)
    strategy.close("L")

if (bearCond)
    strategy.entry("S", strategy.short)
if (bullCond)
    strategy.close("S")

// Plot signals
plotshape(series=bullCond, title="L", location=location.belowbar, color=color.green, style=shape.circle, size=size.small)
plotshape(series=bearCond, title="S", location=location.abovebar, color=color.red, style=shape.circle, size=size.small)
Detail
https://www.fmz.com/strategy/442838
Last Modified
2024-02-26 14:17:36
