-
Notifications
You must be signed in to change notification settings - Fork 10
New issue
Have a question about this project? Sign up for a free GitHub account to open an issue and contact its maintainers and the community.
By clicking “Sign up for GitHub”, you agree to our terms of service and privacy statement. We’ll occasionally send you account related emails.
Already on GitHub? Sign in to your account
Package Basel OGD datasets #11
Comments
|
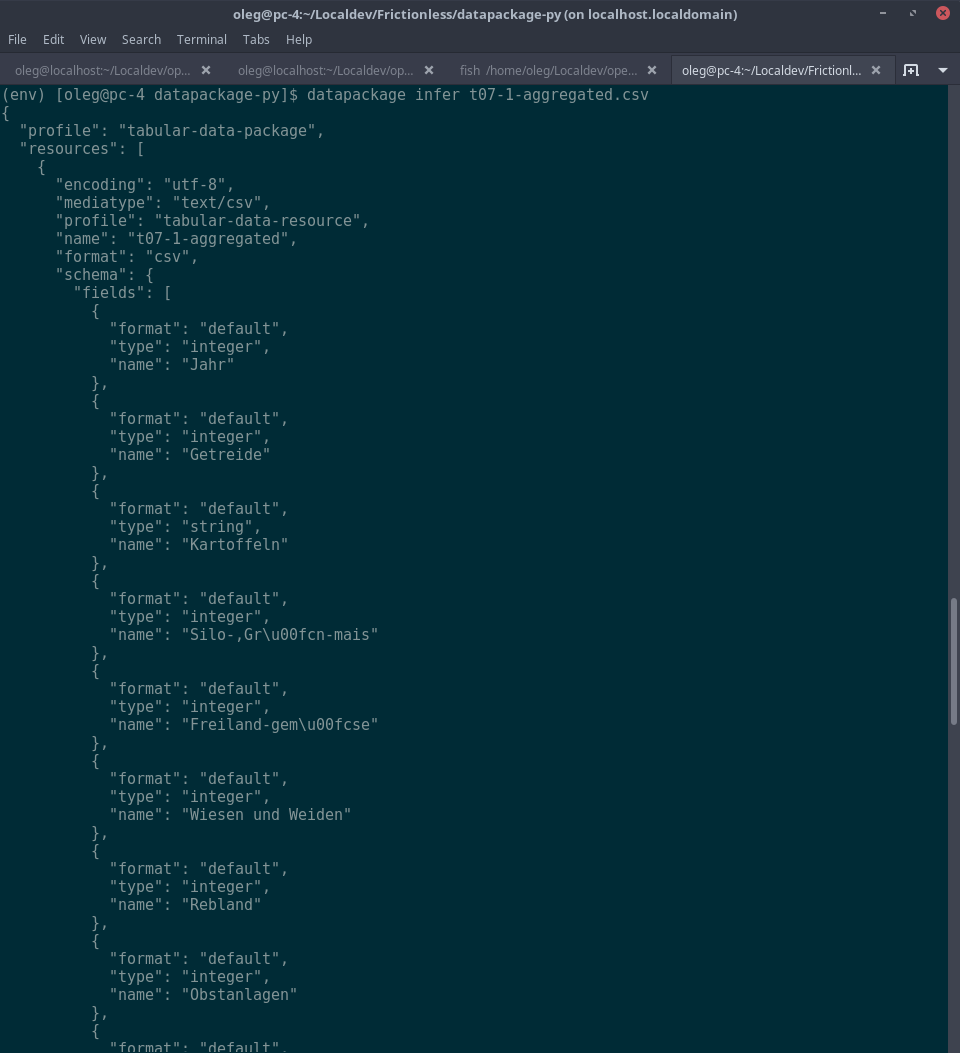
We started a Data Package for the Landwirtschaft (Agriculture) data: https://github.com/foodopendata/foodstats-basel Working screenshots
|
|
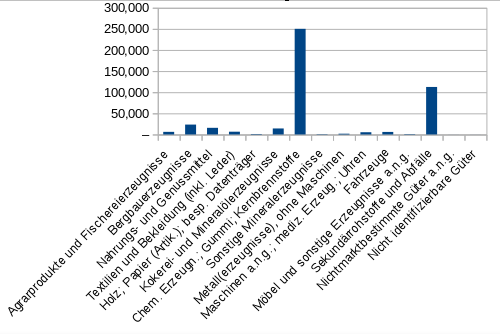
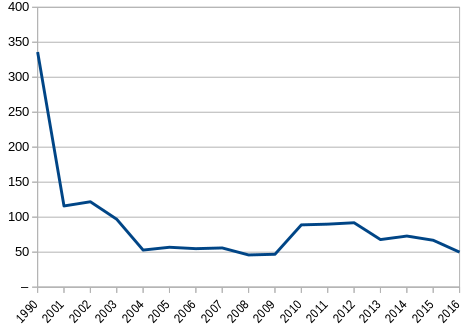
Fun facts from this data, shared in the Hackdays team chat last weekend: Chemical products account for 10x the value of all other products from the city combinedIn 2016, according to T06.4.03. The only industries visible on the graph of exports are textiles and precision machineryThis is also the product group that accounts for more than 50% of the export by weightRecycling and waste accounting for about a quarter of the rest. Just a couple decades ago at least, there was a sizeable population of agriculture workersNow it's stabilized at around 50 in the entire canton. (It's a small canton). That must be a hard working bunch, shipping 22'000 tonnes (2016) of product per year! |
|
The Data Package has also been uploaded to the new DataHub for testing, though we are planning to publish it and others like it under an organisation and not private account. See: |


A number of datasets were suggested by the administration of the Canton of Basel for the upcoming Hackdays. The following information is being translated, converted, and put into a Data Package: https://github.com/foodopendata/foodstats-basel
Wir haben rund um das Thema Food veröffentlichte Geodaten und Statistikdaten. Beides sind offene Daten, jedoch noch keine state of the art OGD. D.h. sie sind noch nicht nachhaltig veröffentlicht. Konkret handelt es sich um folgende Datensätze: z.B. http://www.statistik.bs.ch/zahlen/tabellen.html
Aussenhandel
Exporte
Importe
Transit
Landwirtschaft
Betriebe, Flächen, Tiere
The text was updated successfully, but these errors were encountered: