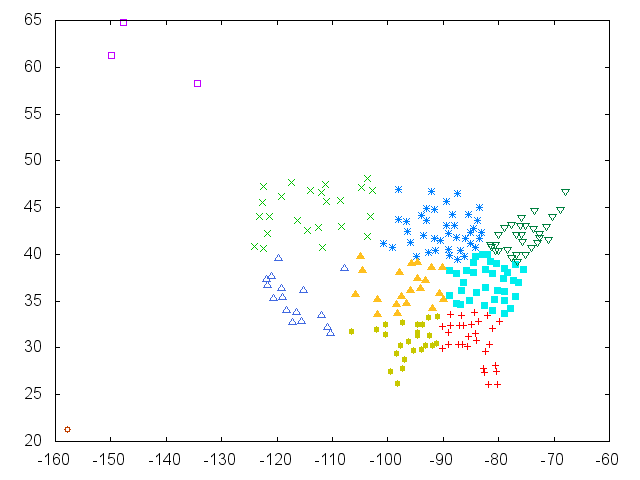
This example clusters US cities based on lat/lng and outputs the clusters to the terminal and to a PNG (requires GNUPlot.)
The number of clusters can be configured on the command line:
./examples/cities.rb -k 10
This example clusters news headlines using a simple word bag extraction of text features. It outputs random samples from each cluster to the terminal.
./examples/headlines.rb -k 16
Datset: Qazvinian and radev 2011.
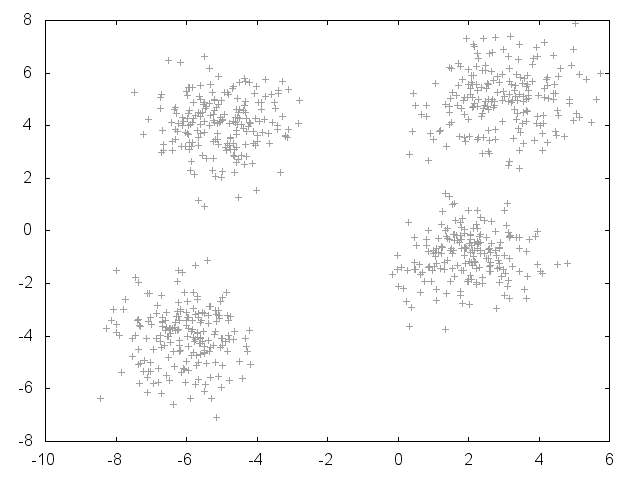
This example shows how to pick the best value for k using both the elbow method and the silhouette method.
./examples/pick_k.rb # requires GNUPlot
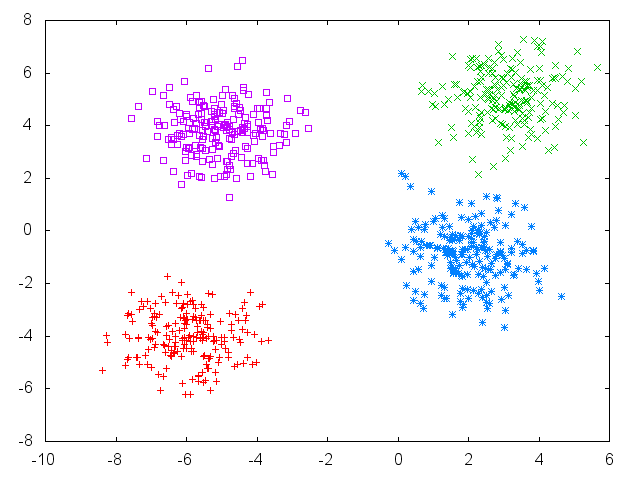
Initial setup of points, with 4 fairly well-defined clusters:
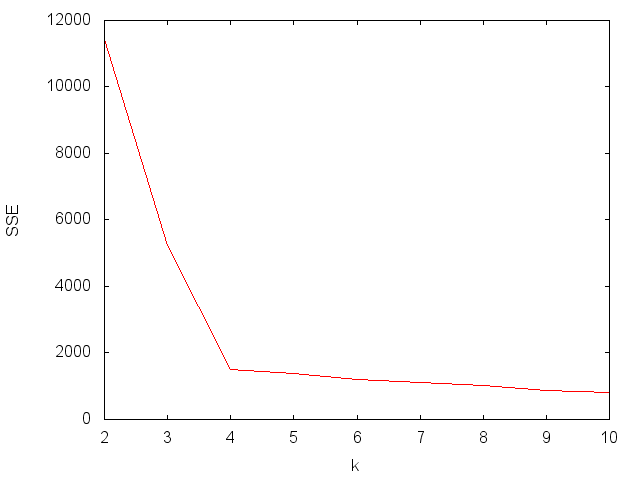
Elbow method - find the point of diminishing returns:
Silhouette method - pick k with the highest silhouette score
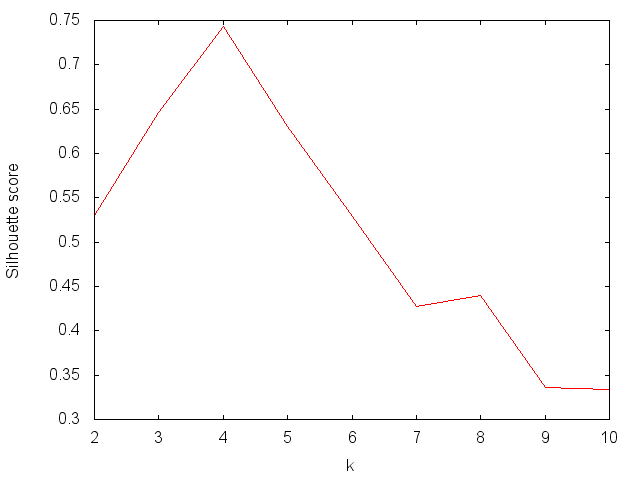
Points plotted with best k value of 4:
This example clusters handwritten digits from the MNIST database of handwritten digits.
To run this example:
-
download the MNIST training set images and training set labels and place them in
examples/data/mnist/ -
run
./examples/mnist.rb -k 10
After running k-means, a test set of digits will be classified (by finding the closest cluster) and outputted to a PNG with each cluster represented as a row.
Example PNG output with k=20:

Output of the training set instances closest to the cluster centroids:
