Monitors with Ignore TLS/SSL error enabled show up as expired in the /metrics
#1474
Open
2 tasks done
Labels
🛡️ Security Policy
Description
Ive noticed in the metrics page that can be used with prometheus, HTTPS servers that dont have a valid signed (but still in date) certificate are displayed as expired despite having
Ignore TLS/SSL error for HTTPS websitesenabled in the advanced section of the monitor.Additionally, ive noticed that monitors that use the
pushtype display as down too (see attached screenshots for both)Im not sure if this is intended behaviour or not, which is why im making this issue
Im using the latest nightly build with docker (1.13.1-nightly)
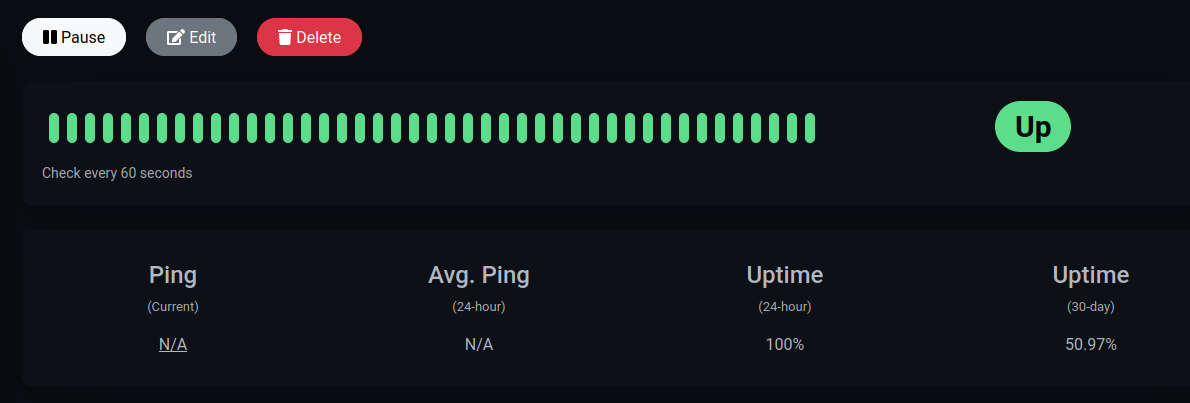
Monitor using push showing as up in the web UI:

Monitor showing as down in the /metrics page:

Monitor with a self signed/unknown CA certificate showing as not expired and displaying the expiry date in the web UI:

Monitor with a self signed/unknown CA certificate showing as expired but still displaying the expiry date on the stats page:


👟 Reproduction steps
Add a HTTPS monitor using a self signed certificate making sure that the
Ignore TLS/SSL error for HTTPS websitesis enabled and it should say as up and have the certificate expiry time. When looking at the /metrics page it will show as expired (0) but still have the expiry dateFor the push monitor, add one and ensure that its being pushed to and showing up in the web UI but in /metrics it will show as down (0)
👀 Expected behavior
The certificate info will respect the
Ignore TLS/SSL error for HTTPS websitesoption for the monitor in the /metrics page and display the same info as the web UIThe push monitor should follow the status in the web UI (up or down)
😓 Actual Behavior
For self signed/unknown CA certificates the monitor displays as expired in /metrics but valid in the web UI but still displays the expiry date
For push monitors, the monitor is displayed as down in /metrics and up on the web UI
🐻 Uptime-Kuma Version
1.13.1-nightly
💻 Operating System and Arch
Ubuntu 18.04.6 LTS x86_64
🌐 Browser
Firefox v99 (64 bit) on ubuntu 21.10
🐋 Docker Version
Docker version 20.10.7, build 20.10.7-0ubuntu5~18.04.3
🟩 NodeJS Version
No response
📝 Relevant log output
No response
The text was updated successfully, but these errors were encountered: