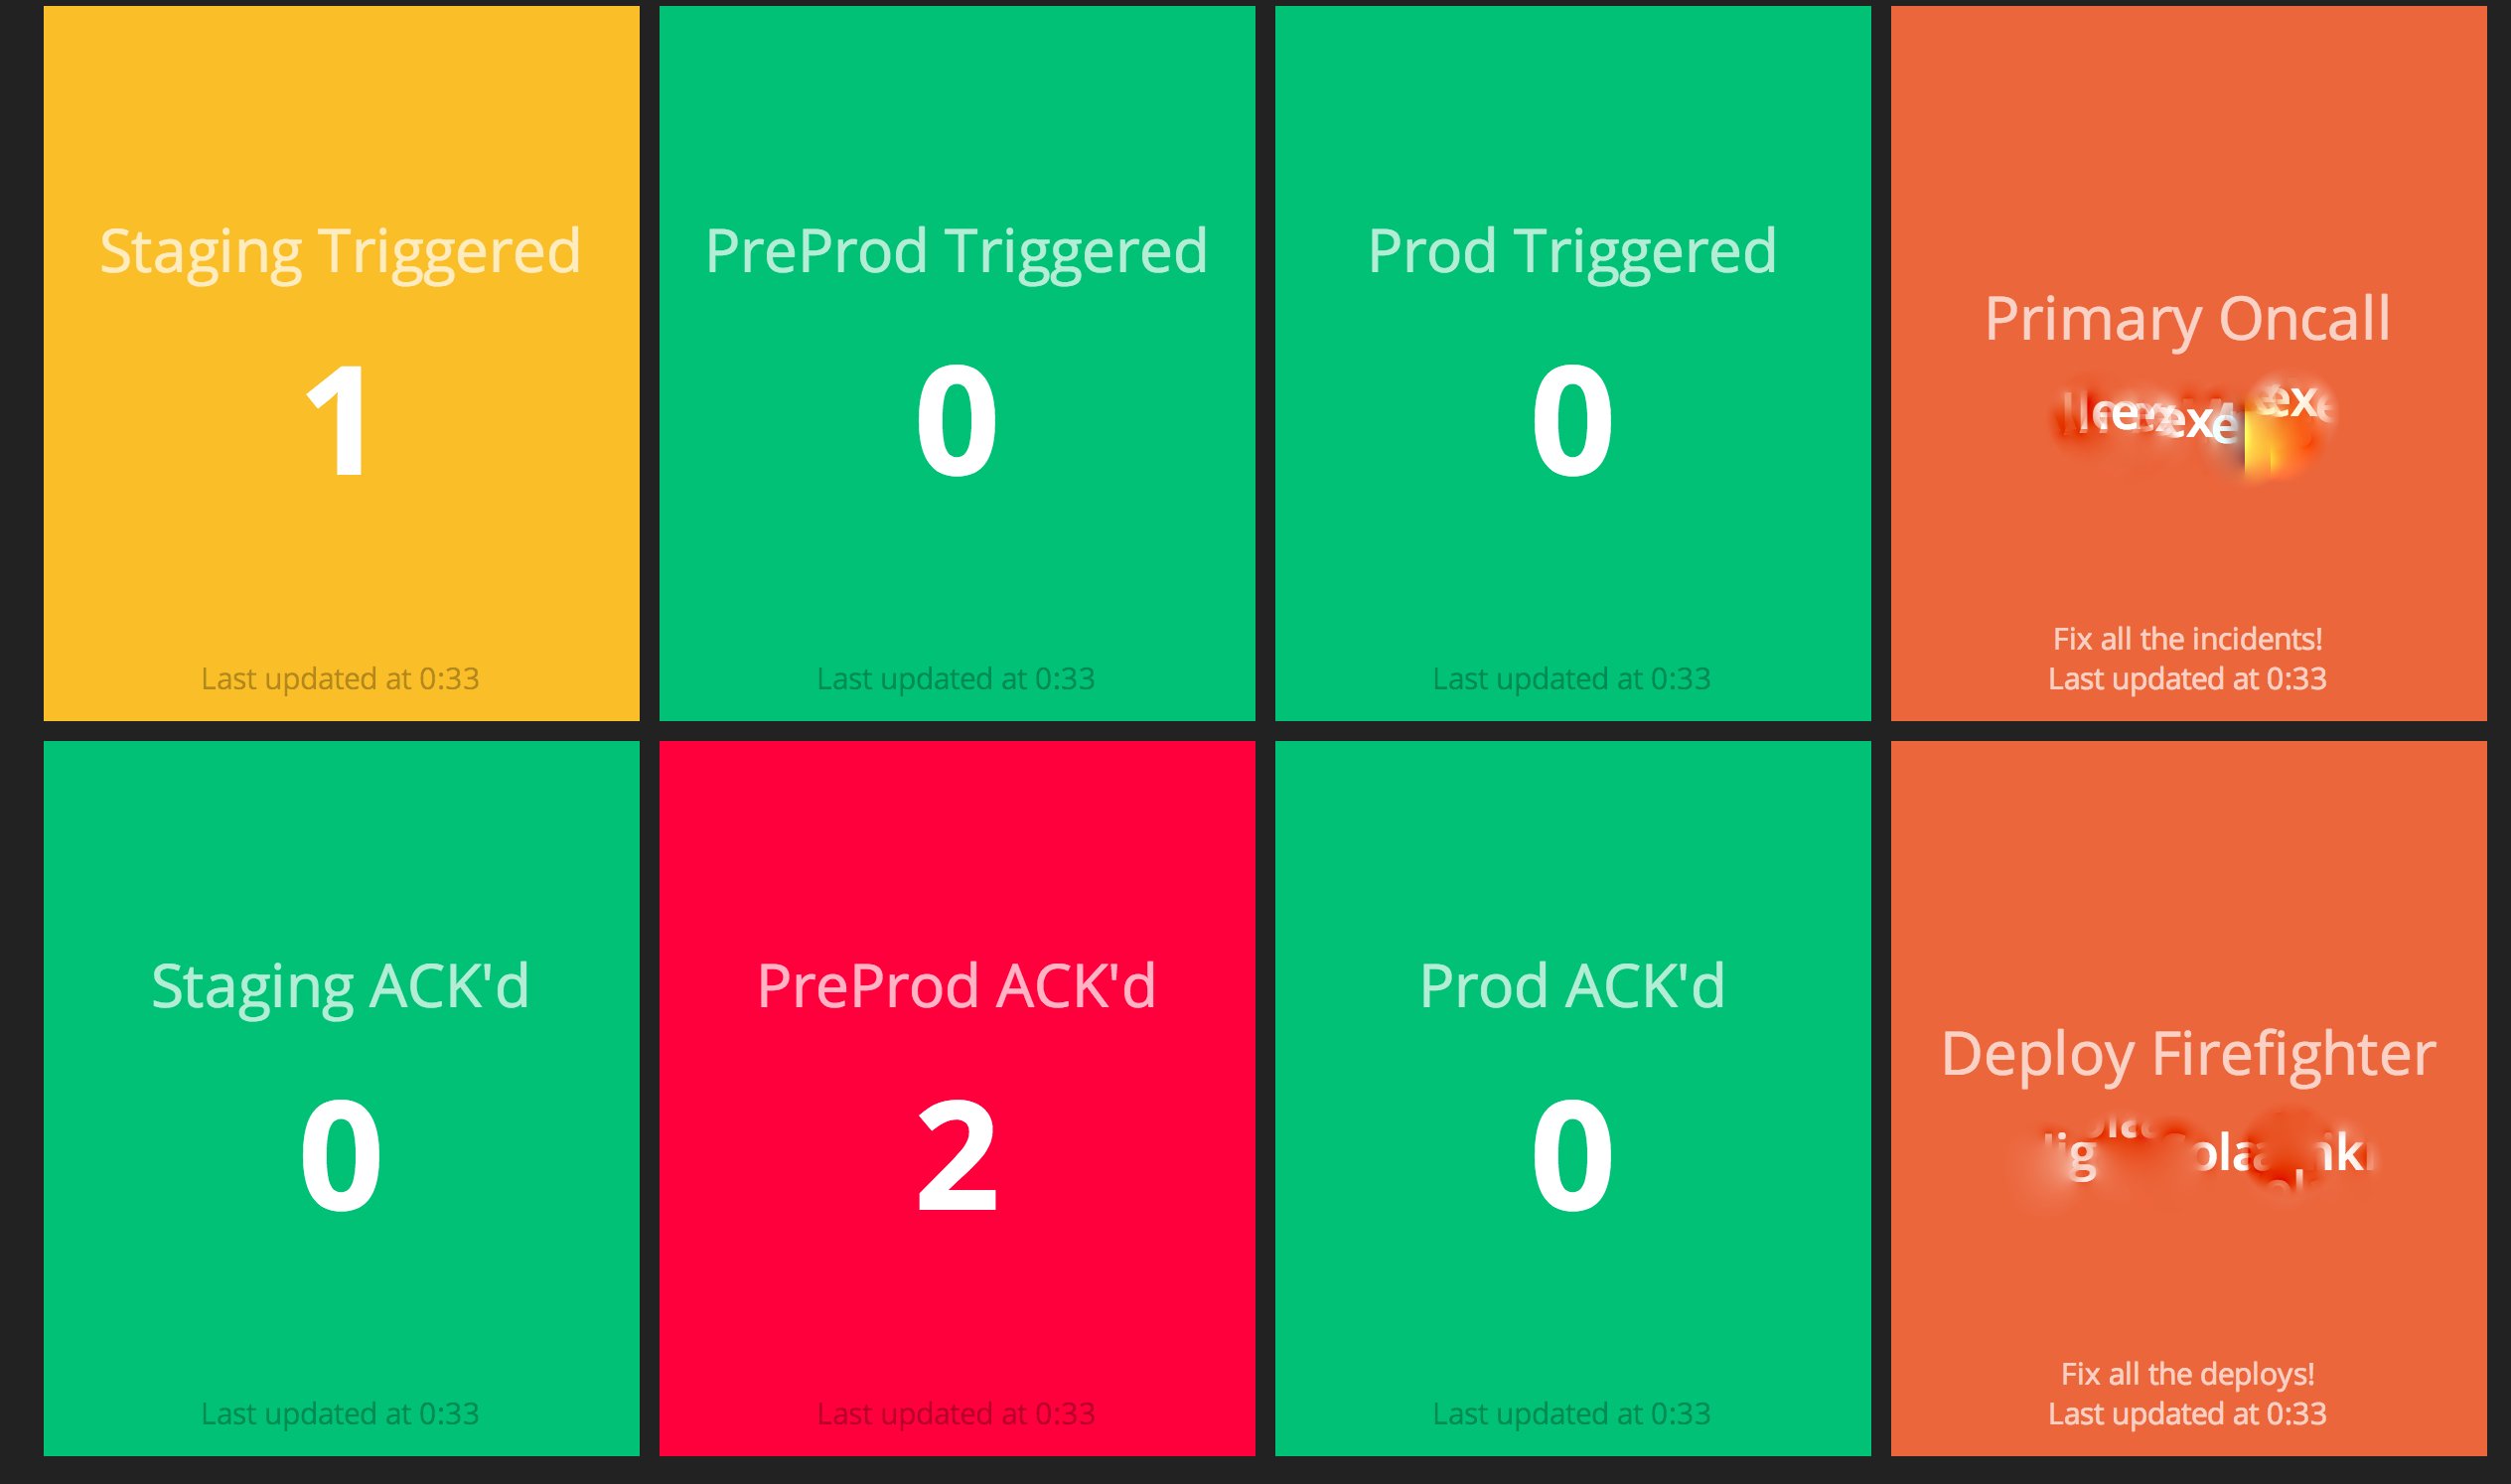
A Dashing dashboard for PagerDuty Services!
- Show the number of triggered and acknowledged incidents using the hotness widget.
- Display who's on-call for a particular PagerDuty schedule.
The easiest way to get started is to use Heroku button above to launch your dashboard. You will need to fill out the following environment variables in Heroku so your Dashing dashboard can communicate to the PagerDuty API.
| Environment Variable | Example |
|---|---|
| PAGERDUTY_URL | https://yoursubdomain.pagerduty.com |
| PAGERDUTY_APIKEY | Your api key (this can be a read only key) |
| PAGERDUTY_SERVICES | {"services": { "staging": "ABC1234","preprod": "QAZ4567","production": "EDC4321"}} |
| PAGERDUTY_SCHEDULES | {"schedules": { "oncall": "ABC1234","firefighter": "QAZ4567"}} |
Clicking on a Service/Schedule in PagerDuty will show you the ID in the URL.
The Services/Schedules need to be in JSON format. In order for Heroku to accept them, they need to contain no line breaks.

