-
-
Notifications
You must be signed in to change notification settings - Fork 18.1k
New issue
Have a question about this project? Sign up for a free GitHub account to open an issue and contact its maintainers and the community.
By clicking “Sign up for GitHub”, you agree to our terms of service and privacy statement. We’ll occasionally send you account related emails.
Already on GitHub? Sign in to your account
BUG: xlim and ylim not restricting plot area #40781
Comments
|
I think it should be |
|
after comment from @rhshadrach, I was successful in debugging what was happening. I was processing command line parameters with argparse and this behaviour seems to occur when the supplied |
|
Thanks for reporting back @regmibijay - I agree and think either are a workable solution, although I personally would lean toward raising if the values are not numeric. Would you be interested in submitting a PR to implement the patch? |
|
I am working on this issue and will address with a PR soon! |

I have checked that this issue has not already been reported.
I have confirmed this bug exists on the latest version of pandas.
(optional) I have confirmed this bug exists on the master branch of pandas.
Code Sample, a copy-pastable example
Problem description
I am plotting a large dataset using
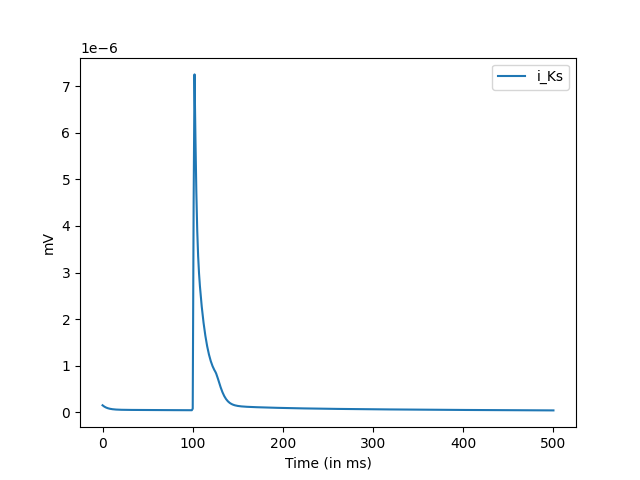
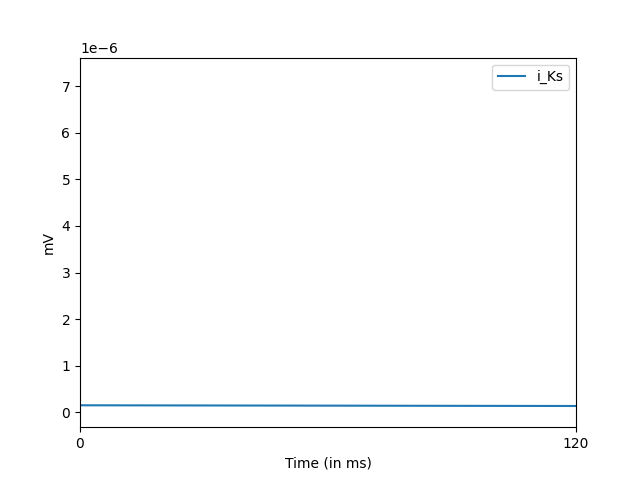
dataframe.plot()in pandas. Dataset contains data in csv format. As per documentation, I specifyxlimandylimas arg in df.plot. Now the axes take the xlim and ylim values accordingly but the figure does not scale to these values and plot shows some part of of graph but not the area defined by 'xlim' and 'ylim'.without xlim :


with xlim set :
sample files here: samples
project: project
Expected Output
I want to plot only the specified area. In my example image it would be the spike.
Output of
pd.show_versions()INSTALLED VERSIONS
commit : f2c8480
python : 3.9.2.final.0
python-bits : 64
OS : Linux
OS-release : 4.4.0-19041-Microsoft
Version : #488-Microsoft Mon Sep 01 13:43:00 PST 2020
machine : x86_64
processor :
byteorder : little
LC_ALL : None
LANG : en_US.UTF-8
LOCALE : en_US.UTF-8
pandas : 1.2.3
numpy : 1.20.2
pytz : 2021.1
dateutil : 2.8.1
pip : 21.0.1
setuptools : 52.0.0
Cython : None
pytest : None
hypothesis : None
sphinx : None
blosc : None
feather : None
xlsxwriter : None
lxml.etree : None
html5lib : None
pymysql : None
psycopg2 : None
jinja2 : 2.11.3
IPython : 7.22.0
pandas_datareader: None
bs4 : 4.9.3
bottleneck : None
fsspec : None
fastparquet : None
gcsfs : None
matplotlib : 3.4.1
numexpr : None
odfpy : None
openpyxl : 3.0.7
pandas_gbq : None
pyarrow : None
pyxlsb : None
s3fs : None
scipy : 1.6.2
sqlalchemy : None
tables : None
tabulate : None
xarray : None
xlrd : None
xlwt : None
numba : None
The text was updated successfully, but these errors were encountered: