Radial HeatMap option doesn't work with Dataset.to #2610
Comments
|
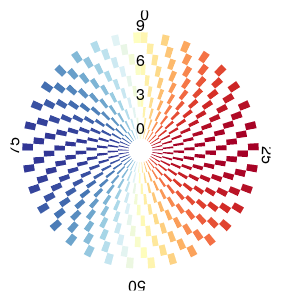
It looks like overlays don't work, either. Using the same Dataset as above, %opts HeatMap [radial=True]
hm1 = hv.HeatMap(ds.select(Thirds=True), ['Index', 'Repetition'])
hm1
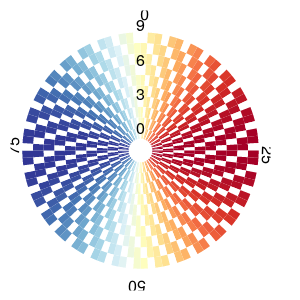
And this works %opts HeatMap [radial=True]
hm2 = hv.HeatMap(ds.select(Thirds=False), ['Index', 'Repetition'])
hm2
And this works: %opts HeatMap [radial=True]
hm1 + hm2
But this doesn't: %opts HeatMap [radial=True]
hm1*hm2
|

|
There is also no colorbar with radial heatmaps: %%opts HeatMap [radial=True colorbar=True]
hv.HeatMap(ds.select(Thirds=True), ['Index', 'Repetition'])Doesn't show any legend. |
|
Thanks, hopefully we can get a fix for this into 1.10.2. |
3 tasks
Sign up for free
to join this conversation on GitHub.
Already have an account?
Sign in to comment
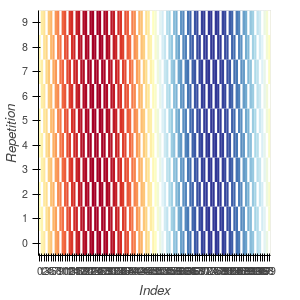
Radial HeatMaps work when declaring a HeatMap directly, but don't seem to work when using
Dataset.to. Consider the following Dataset:If we select one value of
Thirdsand make a radial HeatMap with that, it works properly:However, if we use
Dataset.toon the same data to get a dropdown, the HeatMap isn't radial:I would be willing to use an ugly workaround to get this working if it is available.
The text was updated successfully, but these errors were encountered: