Supercharge Investment Analysis with MongoDB and CrewAI full blog post
(image from LangChain Blog | CrewAI: The Future of AI Agent Teams)
The MongoDB Aggregation Pipeline gives us the data we need to analyze. The faster you can extract meaningful insights from raw data, the better your investment decisions will be. CrewAI, combined with the power of MongoDB Atlas, provides a unique approach that goes beyond basic number-crunching to deliver truly actionable analysis.
For this example, we will create an Investment Researcher Agent. This agent is our expert, skilled in finding valuable data using tools like search engines. It's designed to hunt down financial trends, company news, and analyst insights. To learn more about creating agents using CrewAI click here
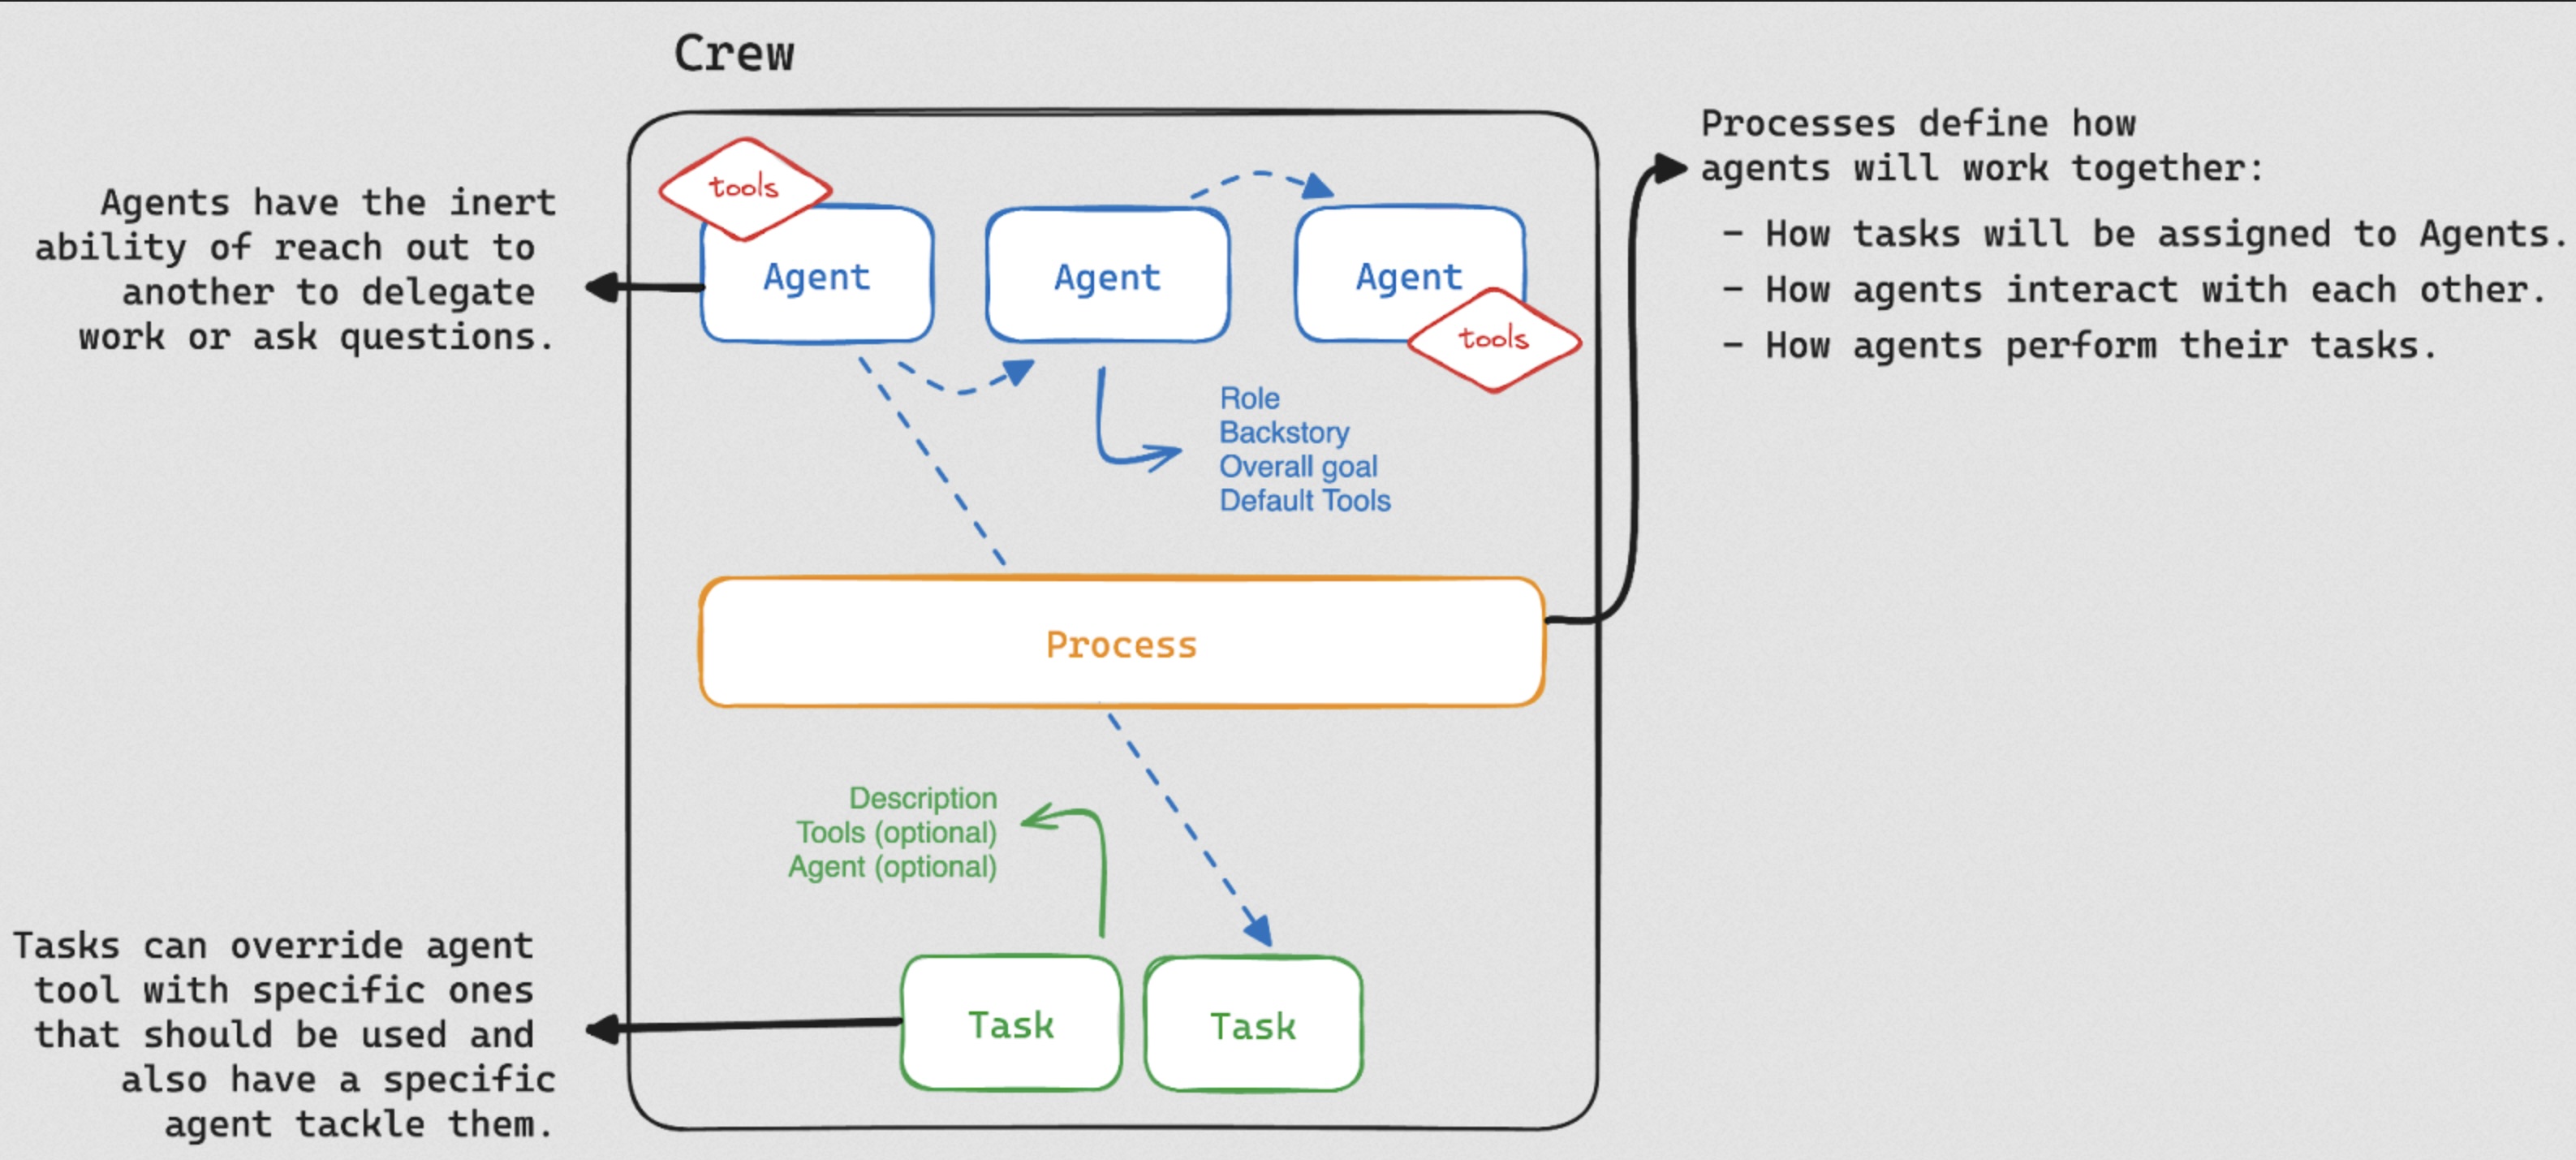
Unlocking the Power of AI Collaboration: Agents, Tasks, and Tools
In essence, CrewAI's powerful combination of agents, tasks, and tools empowers you to:
- Automate repetitive tasks: Free up your team's valuable time and resources by automating mundane or repetitive tasks.
- Streamline workflows: Design efficient workflows that leverage the strengths of AI collaboration.
- Unlock the true potential of AI: Move beyond basic AI functionalities and harness the power of collaborative AI for complex projects.
Before We Start
To follow along, you'll need:
-
MongoDB Atlas Cluster: Create your free cluster and load the Sample Dataset. The transaction data in the sample analytics dataset offers a realistic dataset that allows users to hone their skills in data analysis, querying, and aggregation, particularly in the context of financial data.
-
LLM Resource: CrewAI supports various LLM connections, including local models (Ollama), APIs like Azure, and all LangChain LLM components for customizable AI solutions. Click here to learn more about CrewAI LLM Support

Next, we set up our connection to Azure OpenAI. Azure OpenAI can be replaced by your preferred LLM.
from langchain_openai import AzureChatOpenAI

AZURE_OPENAI_ENDPOINT = "https://__DEMO__.openai.azure.com"
AZURE_OPENAI_API_KEY = "__AZURE_OPENAI_API_KEY__"
deployment_name = "gpt-4-32k"  # The name of your model deployment
default_llm = AzureChatOpenAI(
	openai_api_version=os.environ.get("AZURE_OPENAI_VERSION", "2023-07-01-preview"),
	azure_deployment=deployment_name,
	azure_endpoint=AZURE_OPENAI_ENDPOINT,
	api_key=AZURE_OPENAI_API_KEY
)Then let's set the agent role and the agent goal as a variable so that it can be accessed throughout the script.
# Initial Setup
AGENT_ROLE = "Investment Researcher"
AGENT_GOAL = """
  Research stock market trends, company news, and analyst reports to identify potential investment opportunities.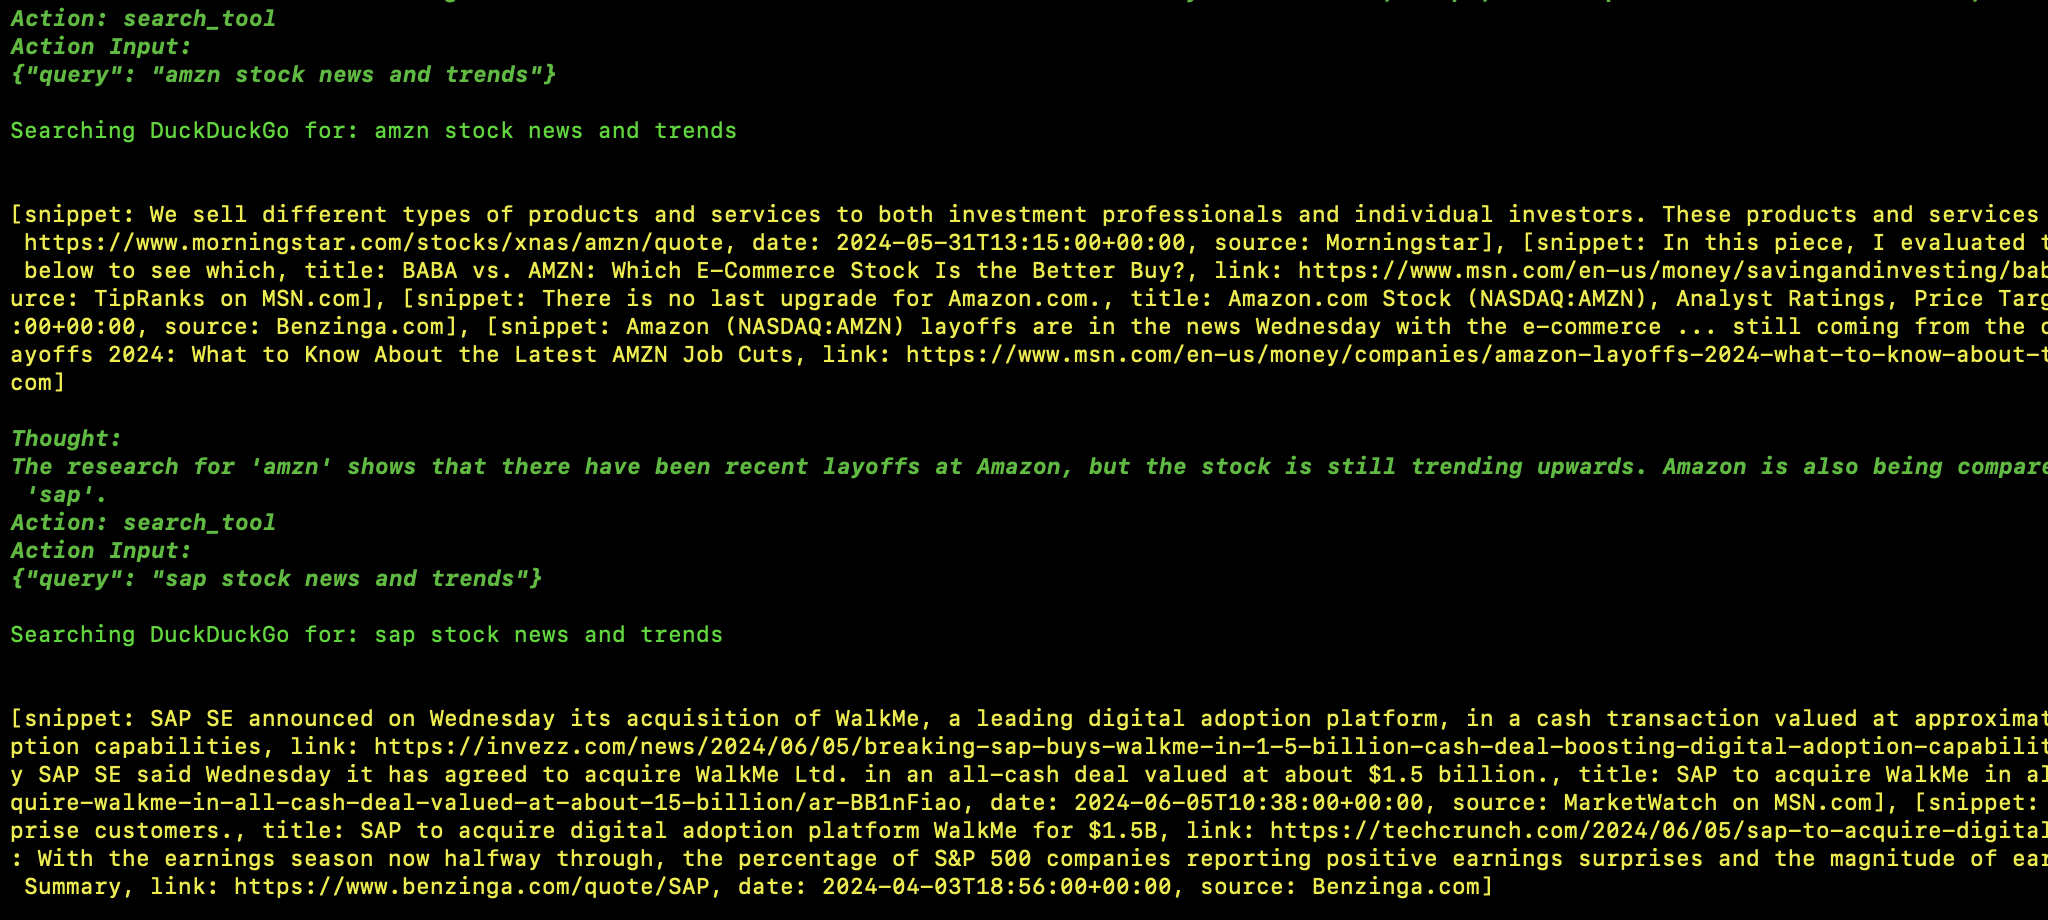
"""For this example, we will be using the The DuckDuckGo Search Langchain Integration. The DuckDuckGo Search is a component that allows users to search the web using DuckDuckGo. You can implement your Search Tool with your Search API of choice - it does not have to be DuckDuckGo.
# Web Search Setup
from langchain.tools import tool
from langchain_community.tools import DuckDuckGoSearchResults
duck_duck_go = DuckDuckGoSearchResults(backend="news")

# Search Tool - Web Search
@tool
def search_tool(query: str):
  """
  Perform online research on a particular stock.
  """
return duck_duck_go.run(query)We'll be using CrewAI to manage our agents and tasks. In this case, we have one agent - a researcher who is tasked with analyzing the data and providing actionable insights.
# Research Agent Setup
from crewai import Crew, Process, Task, Agent

researcher = Agent(
  role='Investment Researcher',
  goal="""
  Research market trends, company news, and analyst reports to identify potential investment opportunities.
  """,
  verbose=True,
  llm=default_llm,
  backstory='Expert in using search engines to uncover relevant financial data, news articles, and industry analysis.',
  tools=[search_tool]
)

analysis_task = Task(
  description="""
Using the following information:

[VERIFIED DATA]
{agg_data}

*note*
The data represents the average price of each stock symbol for each transaction type (buy/sell),
and the total amount of transactions for each type. This would give us insight into the average costs and proceeds from each stock,
as well as the volume of transactions for each stock.
[END VERIFIED DATA]

[TASK]
- Provide a financial summary of the VERIFIED DATA
- Research current events and trends, and provide actionable insights and recommendations
  """,
  agent=researcher,
  expected_output='concise markdown financial summary and list of actionable insights and recommendations',
  tools=[search_tool],
)

tech_crew = Crew(
  agents=[researcher],
  tasks=[analysis_task],
  process=Process.sequential
)Next, we define our MongoDB aggregation pipeline. This pipeline is used to process our transaction data and calculate the return on investment for each stock symbol.
# MongoDB Aggregation Pipeline
pipeline = [
{
"$unwind": "$transactions" # Deconstruct the transactions array into separate documents
},
{
"$group": { # Group documents by stock symbol
"_id": "$transactions.symbol", # Use symbol as the grouping key
"buyValue": { # Calculate total buy value
"$sum": {
"$cond": [ # Conditional sum based on transaction type
{ "$eq": ["$transactions.transaction_code", "buy"] }, # Check for "buy" transactions
{ "$toDouble": "$transactions.total" }, # Convert total to double for sum
0 # Default value for non-buy transactions
]
}
},
"sellValue": { # Calculate total sell value (similar to buyValue)
"$sum": {
"$cond": [
{ "$eq": ["$transactions.transaction_code", "sell"] },
{ "$toDouble": "$transactions.total" },
0
]
}
}
}
},
{
"$project": { # Project desired fields (renaming and calculating net gain)
"_id": 0, # Exclude original _id field
"symbol": "$_id", # Rename _id to symbol for clarity
"netGain": { "$subtract": ["$sellValue", "$buyValue"] } # Calculate net gain
}
},
{
"$sort": { "netGain": -1 } # Sort results by net gain (descending)
},
{"$limit": 3} # Limit results to top 3 stocks
]
results = list(collection.aggregate(pipeline))
client.close()
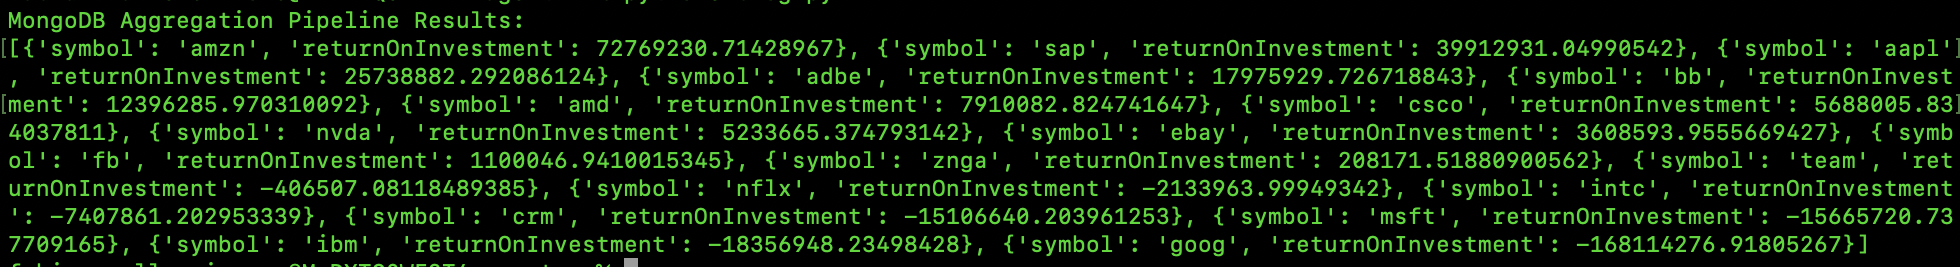
print("MongoDB Aggregation Pipeline Results:")
print(results)Here's a breakdown of what the MongoDB pipeline does:
-
Unwinding Transactions: First, it uses the
$unwindoperator to unpack an array field named "transactions" within each document. Imagine each document has information about multiple stock purchases and sales. Unwinding separates these transactions into individual documents, making calculations easier. -
Grouping by Symbol: Next, the
$groupoperator takes over. It groups the unwound documents based on the value in the "transactions.symbol" field. This essentially combines all transactions for a specific stock (represented by the symbol) into a single group. -
Calculating Buy and Sell Values: Within each symbol group, the pipeline calculates two crucial values:
- buyValue: This uses the
$sumaccumulator along with a conditional statement ($cond). The$condchecks if the "transaction_code" within the "transactions" object is "buy". If it is, it converts the "total" field (the transaction amount) to a double using$toDoubleand adds it to the running total for buyValue. If it's not a buy transaction, it contributes nothing (0) to the sum. This effectively calculates the total amount spent buying shares of that specific symbol. - sellValue: Similar to buyValue, this calculates the total amount received by selling shares of the same symbol. It uses the same logic but checks for "transaction_code" equal to "sell" and sums those "total" values.
- buyValue: This uses the
-
Projecting Results: Now, the
$projectoperator steps in to define the final output format. It discards the automatically generated grouping identifier (_id) by setting it to 0. It then renames the grouping field (_idwhich held the "transactions.symbol") to a clearer name, "symbol". Finally, it calculates the return on investment for each symbol using the$subtractoperator. This subtracts thebuyValuefrom thesellValueto determine the profit or loss for that symbol. -
Sorting by Return: Lastly, the
$sortoperator organizes the results. It sorts the documents based on the "returnOnInvestment" field in descending order (-1). This means symbols with the highest return on investment (most profitable) will appear first in the final output.
Finally, we kick off our task execution. The researcher agent will use the data from our MongoDB aggregation, as well as any other tools at their disposal, to analyze the data and provide insights.
Final Answer:
# Detailed Financial Report

## TLDR Summary

Based on the net gain data and recent news trends, all three stocks – Amazon (AMZN), SAP (SAP), and Apple (AAPL) – show promising prospects. Amazon and Apple are experiencing growth and their stocks are hitting new highs. SAP has recently acquired WalkMe, indicating potential future growth.

## Key Insights and Recommendations

### Amazon (AMZN)
- Net Gain: $72,769,230.71
- Recent News: Amazon is poised for its next decade of growth after delivering a return of around 1,000% over the last decade. Its stock price recently hit a new all-time high.
- Recommendation: With its stock hitting an all-time high and positive future growth outlook, Amazon presents a solid investment opportunity for long-term investors.

### SAP (SAP)
- Net Gain: $39,912,931.04
- Recent News: SAP recently announced an agreement to acquire WalkMe, a digital adoption platform, in an all-cash deal valued at about $1.5 billion. The acquisition is expected to close in the third quarter of 2024.
- Recommendation: The recent acquisition of WalkMe indicates potential for future growth. Investors should keep a close eye on SAP's performance post-acquisition.

### Apple (AAPL)
- Net Gain: $25,738,882.29
- Recent News: Apple's stock has risen substantially since releasing its fiscal Q2 earnings. It is predicted to still be undervalued based on its powerful free cash flow.
- Recommendation: Given the powerful free cash flow and the potential for an AI-driven growth cycle, Apple appears to be a good investment opportunity.

## Other Observations

While all three stocks show promising prospects, it's important for investors to consider their own risk tolerance and investment goals before making investment decisions. It's also important to keep an eye on the market trends and news, as they can greatly impact the stock prices.

## Conclusion

In conclusion, Amazon, SAP, and Apple present promising investment opportunities based on their recent news and net gain data. However, as with all investments, potential investors should conduct thorough research and consider their own investment goals and risk tolerance.
While the combination of MongoDB's Aggregation Framework and GenAI represents a powerful tool for data analysis and interpretation, it's important to recognize a few potential limitations:
-
Dependence on Historical Data: Past performance may not always predict future results, especially in unpredictable markets where unforeseen events can significantly impact investment outcomes.
-
Uncertainty in Predictions: Despite the sophistication of the analysis, there will always be an inherent degree of uncertainty in investment predictions. Future outcomes are inherently unknowable, and factors beyond the scope of historical data can influence results.
-
LLM Limitations: LLMs are still evolving, and their ability to research, interpret and analyze data is continually improving. However, biases in training data or limitations in the model's architecture could lead to inaccurate or misleading insights.
By being aware of these limitations and taking steps to mitigate them, you can ensure a more responsible and well-rounded approach to investment analysis.