-
Notifications
You must be signed in to change notification settings - Fork 296
/
Copy pathIntroduction_to_R.Rmd
642 lines (453 loc) · 19.5 KB
/
Introduction_to_R.Rmd
1
2
3
4
5
6
7
8
9
10
11
12
13
14
15
16
17
18
19
20
21
22
23
24
25
26
27
28
29
30
31
32
33
34
35
36
37
38
39
40
41
42
43
44
45
46
47
48
49
50
51
52
53
54
55
56
57
58
59
60
61
62
63
64
65
66
67
68
69
70
71
72
73
74
75
76
77
78
79
80
81
82
83
84
85
86
87
88
89
90
91
92
93
94
95
96
97
98
99
100
101
102
103
104
105
106
107
108
109
110
111
112
113
114
115
116
117
118
119
120
121
122
123
124
125
126
127
128
129
130
131
132
133
134
135
136
137
138
139
140
141
142
143
144
145
146
147
148
149
150
151
152
153
154
155
156
157
158
159
160
161
162
163
164
165
166
167
168
169
170
171
172
173
174
175
176
177
178
179
180
181
182
183
184
185
186
187
188
189
190
191
192
193
194
195
196
197
198
199
200
201
202
203
204
205
206
207
208
209
210
211
212
213
214
215
216
217
218
219
220
221
222
223
224
225
226
227
228
229
230
231
232
233
234
235
236
237
238
239
240
241
242
243
244
245
246
247
248
249
250
251
252
253
254
255
256
257
258
259
260
261
262
263
264
265
266
267
268
269
270
271
272
273
274
275
276
277
278
279
280
281
282
283
284
285
286
287
288
289
290
291
292
293
294
295
296
297
298
299
300
301
302
303
304
305
306
307
308
309
310
311
312
313
314
315
316
317
318
319
320
321
322
323
324
325
326
327
328
329
330
331
332
333
334
335
336
337
338
339
340
341
342
343
344
345
346
347
348
349
350
351
352
353
354
355
356
357
358
359
360
361
362
363
364
365
366
367
368
369
370
371
372
373
374
375
376
377
378
379
380
381
382
383
384
385
386
387
388
389
390
391
392
393
394
395
396
397
398
399
400
401
402
403
404
405
406
407
408
409
410
411
412
413
414
415
416
417
418
419
420
421
422
423
424
425
426
427
428
429
430
431
432
433
434
435
436
437
438
439
440
441
442
443
444
445
446
447
448
449
450
451
452
453
454
455
456
457
458
459
460
461
462
463
464
465
466
467
468
469
470
471
472
473
474
475
476
477
478
479
480
481
482
483
484
485
486
487
488
489
490
491
492
493
494
495
496
497
498
499
500
501
502
503
504
505
506
507
508
509
510
511
512
513
514
515
516
517
518
519
520
521
522
523
524
525
526
527
528
529
530
531
532
533
534
535
536
537
538
539
540
541
542
543
544
545
546
547
548
549
550
551
552
553
554
555
556
557
558
559
560
561
562
563
564
565
566
567
568
569
570
571
572
573
574
575
576
577
578
579
580
581
582
583
584
585
586
587
588
589
590
591
592
593
594
595
596
597
598
599
600
601
602
603
604
605
606
607
608
609
610
611
612
613
614
615
616
617
618
619
620
621
622
623
624
625
626
627
628
629
630
631
632
633
634
635
636
637
638
639
640
641
---
title: 'Bioinformatics for Big Omics Data: Introduction to R (and related tools)'
author: "Raphael Gottardo"
date: "December 8, 2014"
output:
ioslides_presentation:
fig_caption: yes
fig_retina: 1
keep_md: yes
smaller: yes
beamer_presentation: default
---
```{r, echo=FALSE}
library("knitr")
opts_chunk$set(tidy=TRUE, tidy.opts=list(blank=FALSE, width.cutoff=80),cache=TRUE)
```
## What is Bioinformatics?
- It depends who you ask but, according to [Wikipedia](http://www.wikipedia.org):
> Bioinformatics is an interdisciplinary field that develops and improves on methods for storing, retrieving, organizing and analyzing biological data.
- Also according to [Wikipedia](http://www.wikipedia.org):
> Bioinformatics uses many areas of computer science, mathematics and engineering to process biological data.
- **What about statistics?** Statistics plays an important role in Bioinformatics. You can't analyze data without statistics.
- **Bioinformatics is an art** that involves biology, statistics, mathematics, programming, and discipline (e.g. reproducibility).
## Outline
The syllabus is available on [GitHub](https://github.com/) at [https://github.com/raphg/Biostat-578](https://github.com/raphg/Biostat-578)
- All lecture notes, R code, etc, are (will) also be available there.
- Lecture notes are written in R markdown and processed using knitr, and thus are **fully reproducible** including R code and examples. The notes are fully versioned via git (and [GitHub](https://github.com/)).
- You will learn more about these tools later.
- You are more than welcome to modify, correct and/or contribute. Very easy to do via **pull requests**. Please do not send me correction via emails.
- **Grading scheme (Tentative)** HW: 40%, Midterm: 30%, Final project: 30%
## Reproducible research
Throughout this course, I will emphasize the use of open source tools for reproducible research. You might want to read the following article:
Huang, Y., & Gottardo, R. (2012). Comparability and reproducibility of biomedical data. *Briefings in bioinformatics*. doi:10.1093/bib/bbs078
I expect each one of you to become familiar with:
- [R](r-project.org) and [RStudio](r-project.org)
- [knitr](http://yihui.name/knitr/). An R package to provide dynamic report generation with R.
- [git](http://git-scm.com/) and [GitHub](https://github.com/). RStudio provides an integrated client for git, GitHub also provides a nice client.
We will make heavy use of these tools throughout the course.
## What is git?
Git is version control software, it manages changes to a project without overwriting any part of that project. Great for collaborating on projects (e.g. software code).
<img src="http://git-scm.com/book/en/v2/book/01-introduction/images/distributed.png" width="400">
## What is GitHub
GitHub = hosting for Git. GitHub is a social version of git, on the web with a user community. Great for finding users, collaborators, projects, but also contribute to existing project.
**Some added features:** Forks/Pull requests
GitHub is a great platform for bioinformatics projects.
We will make extensive use of GitHub during this class, and in particular for your homework.
## GitHub Glossary
- **Repository (repo):** A repository is the most basic element of GitHub. They're easiest to imagine as a project's folder.
- **Branch:** A parallel version of a repository
- **Clone:** Local copy of the repository
- **Commit:** An individual change to a file (or set of files). Commits usually contain a commit message.
- **Fork:** A personal copy of another user's repository that lives on your account
- **Merge:** Merging takes the changes from one branch (in the same repository or from a fork), and applies them into another.
- **Pull:** Pull refers to when you are fetching in changes and merging them.
- **Pull Request:** Pull requests are proposed changes to a repository submitted by a user and accepted or rejected by a repository's collaborators
- **Push:** Pushing refers to sending your committed changes to a remote repository such as github.com
[More details here](https://help.github.com/articles/github-glossary/)
## Some R history
- R is the son of S
- S is a statistical programming language developed by John Chambers from Bell Labs
- Goal of S was "to turn ideas into software, quickly and faithfully"
- S was created in 1976
- New S language arrived in 1988 (Blue Book) and introduced many changes (macros to functions)
- Version 4 was introduced in 1998 and introduced a formal class-method model
- In 1993, StatSci (maker of S-Plus) acquire exclusive license to S
- S-Plus integrates S with a nice GUI interface and full customer support
- R was created by Ross Ihaka and Robert Gentleman at the University of Auckland, New Zealand
## R
- The R project started in 1991
- R first appeared in 1996 as an open-source software!
- **Highly customizable via packages**
- R based community, power of collaboration with thousands of packages freely available
- Many of my favorite R capabilities are not part of the base distribution
- Many graphical user interface to R both free and commercial (e.g. R studio and Revolution)
## What is R?
R is an integrated suite of software facilities for data manipulation, calculation and graphical display. It includes:
- an effective data handling and storage facility
- a suite of operators for calculations on arrays, in particular matrices
- a large, coherent, integrated collection of intermediate tools for data analysis
- graphical facilities for data analysis and display either on-screen or on hardcopy, and
- well-developed, simple and effective programming language which includes conditionals, loops, user-defined recursive functions and input and output facilities.
## R in the NY Times
"Despite" being free and open-source, R is widely used by data analysts inside corporations and academia.
See [NY Times](http://www.nytimes.com/2009/01/07/technology/business-computing/07program.html?pagewanted=all&_r=0) article

## R in Nature
<iframe src="http://www.nature.com/news/programming-tools-adventures-with-r-1.16609?WT.ec_id=NATURE-20141225"></iframe>
## Some references
Some references to get you started if you need to brush up your R skills.
- [aRrgh: a newcomer's (angry) guide to R](http://tim-smith.us/arrgh/) by Tim Smith and Kevin Ushey
- [Introductory Statistics with ](http://www.amazon.com/Introductory-Statistics-R-Computing/dp/0387790535) by Peter Dalgaard
- R reference card http://cran.r-project.org/doc/contrib/Short-refcard.pdf
- R tutorial http://www.cyclismo.org/tutorial/R/
- [R project](http://r-project.org) and [Bioconductor](bioconductor.org)
More advanced:
- [Hadley Wickham's book](http://adv-r.had.co.nz/)
## RStudio
[RStudio](http://www.rstudio.com/) is a free and open source integrated development environment.
- Cross platform
- Syntax highlighting, code completion, and smart indentation
- Execute R code directly from the source editor
- Easily manage multiple working directories using projects
- Plot history, zooming, and flexible image and PDF export
- Integrated with knitr
- Integrated with Git for version control
## R basics
R is an overgrown calculator!
```{r some-easy-math}
2+2
exp(-2)
pi
sin(2*pi)
```
## Getting help
You can easily find help via the command line:
```{r getting-help}
help(pi) ## equivalent ?pi
?sqrt
?sin
?Special
```
If you don't know the exact name, use
```{r getting-more-help}
help.search("trigonometry")
??trigonometry
```
Or using the help tab integrated in RStudio, or using your favorite search engine!
## Assignment
Need a way to store intermediate results:
```{r storing-things}
x <- 2
y <- 2
x+y
```
Try to use meaningful names!
Have a look at:
- [Hadley Wickham's book](http://adv-r.had.co.nz/)
- [Google's coding standards](http://google-styleguide.googlecode.com/svn/trunk/Rguide.xml)
## Vectorized arithmetic
We cannot do much statistics with a single number!
We need a way to store a sequence/list of numbers
One can simply concatenate elements with the `c` function.
```{r concatenate}
weight <- c(60, 72, 75, 90, 95, 72)
weight[1]
height <- c(1.75, 1.80, 1.65, 1.90, 1.74, 1.91)
bmi <- weight/height^2 ## vector based operation
bmi
```
- Vector based operation are much faster!
- `c` can be used to concatenate strings and numbers.
**Exercise:** Find at least one other way to create a vector.
## Data structures
Even vectors can be limited and we need richer structures.
**Homogeneous:**
- Vectors (1-d)
- Matrix (2-d)
- Arrays (n-d)
Can be logical, integer, double (often called numeric), or character
**Heterogeneous:**
- List
- Dataframes
For more details: [http://adv-r.had.co.nz/Data-structures.html](http://adv-r.had.co.nz/Data-structures.html)
## Vectors
We have three types of vectors: numeric, logical, character
```{r vectors}
## Numeric vectors
x <- c(1, 5, 8)
## Logical vectors
x <- c(TRUE, TRUE, FALSE, TRUE)
## Character vectors
x <- c("Hello", "my", "name", "is", "Francis")
```
**Exercise:** Create a vector with the following elements 1, 3, 10, -1, call your vector x. Take the square root of x. Take the log of (1+x).
## Missing and special values
We have already encountered the `NaN` symbol meaning not-a-number, and `Inf`, `-Inf`. In practical data analysis a data point is frequently unavailable. In R, missing values are denoted by `NA`.
Depending on the context, R provides different ways to deal with missing values.
```{r missing-values}
weight <- c(60, 72, 75, 90, NA, 72)
mean(weight)
mean(weight, na.rm=TRUE)
```
## Matrices and arrays
A matrix is a two dimensional array of numbers. Matrices can be used to perform statistical operations (linear algebra). However, they can also be used to hold tables.
```{r matrices}
x <- 1:12
length(x)
dim(x)
dim(x) <- c(3, 4)
x
```
## Matrices and arrays
```{r matrices-suites}
x <- matrix(1:12, nrow=3, byrow=TRUE)
x <- matrix(1:12, nrow=3, byrow=FALSE)
rownames(x) <- c("A", "B", "C")
colnames(x) <- c("1", "2", "x", "y")
```
## Matrices and Arrays
Matrices can also be formed by "glueing" rows and columns using `cbind` and `rbind`. This is the equivalent of `c` for vectors.
```{r matrices2}
x1 <- 1:4
x2 <- 5:8
y1 <- c(3, 9)
my_matrix <- rbind(x1, x2)
new_matrix <- cbind(my_matrix, y1)
new_matrix
```
n-dimesional arrays generalize matrices, as follows:
```{r arrays, eval=FALSE}
array(1:9, c(3, 3, 3))
```
## Factors
It is common to have categorical data in statistical data analysis (e.g. Male/Female). In R such variables are referred to as factors. Makes it possible to assign meaningful names to categories. A factor has a set of levels.
```{r factors}
pain <- c(0, 3, 2, 2, 1)
fpain <- factor(pain)
levels(fpain) <- c("none", "mild", "medium", "severe")
is.factor(fpain)
is.vector(fpain)
## Additional attribute
levels(fpain)
```
## Factors
A factor is very similar to an integer vector with a set of labels. While factors look like character vectors, they are not. So be careful when converting factors to characters and vice-versa. For example, use `stringsAsFactors = FALSE` when reading dataframes (more on this later).
## Lists
Lists can be used to store objects (of possibly different kinds/sizes) into a larger composite object.
```{r lists}
x <- c(31, 32, 40)
y <- factor(c("F", "M", "M", "F"))
## Different types and dimensions!
z <- c("London", "School")
my_list <- list(age=x, sex=y, meta=z)
my_list
my_list$age
```
## Data Frames
A data frame is a "data matrix" or a "data set". It is a list of vectors and/or factors of the same length that are related "across" such that data in the same position come from the same experimental unit (subject, gene, etc).
```{r data-frames}
my_df <- data.frame(age=c(31, 32, 40, 50), sex=c("M", "M", "F", "M"))
my_df$age
```
Why do we need data frames if it is simply a list?
- More efficient storage, and indexing!
Dataframes are similar to database tables.
R provides some (more efficient) alternatives to dataframe. More later!
## Names
Name(s) of an R object can be accessed and/or modified with the `names` function (method).
```{r names}
x <- rep(1:3)
names(x)
names(x) <- c("a", "b", "c")
my_df <- data.frame(age=c(31,32,40,50), sex=y)
my_df
names(my_df)
names(my_df) <- c("age", "gender")
names(my_df)[1] <- c("Age")
```
Names are a special kind of attributes. See more here: http://adv-r.had.co.nz/Data-structures.html##attributes
## Indexing
Indexing is a great way to directly
access elements of interest.
```{r indexing}
## Indexing a vector
pain <- c(0, 3, 2, 2, 1)
pain[1]
pain[2]
pain[1:2]
pain[c(1, 3)]
pain[-5]
```
Note that with a data frame, the indexing of subject is straightforward!
## Indexing
```{r indexing-suite}
## Indexing a matrix
my_matrix[1, 1]
my_matrix[1, ]
my_matrix[, 1]
my_matrix[, -2]
## Indexing list is done in the same way
my_list[3]
my_list[[3]]
my_list[[3]][1]
## Indexing a data frame
my_df[1, ]
my_df[2, ]
```
## Indexing by name
<div class="columns-2">
```{r indexing-by-name}
my_list$age
my_list["age"]
my_list[["age"]]
my_df["Age"]
## Try also
## my_df[1]
## my_df[[1]]
```
What is the main difference between `[[]]` and `[]`?
</div>
## Conditional indexing
Indexing can be conditional on another variable!
```{r conditional-indexing}
pain <- c(0, 3, 2, 2, 1)
sex <- factor(c("M", "M", "F", "F", "M"))
age <- c(45, 51, 45, 32, 90)
pain[sex=="M"]
pain[age>32]
```
**Exercise:** Do the same by indexing with F.
Do the same with age less than 80.
## Functions and arguments
Many things in R are done using function calls, commands that look like an application of a mathematical function of one or several variables, e.g. `log(x)`, `plot(weight,height)`
We will see more on this when explore advance graphics in R.
Most function arguments have sensible default and can thus be omitted, e.g. `plot(weight, height, col=1)`
**Note:** If you do not specify the names of the argument, the order is important!
## Loops and conditional statements
R is a true programming language, and thus has a rich syntax including `for` loops and conditional statements (`while`, `if`, `ifelse`, etc).
```{r if-statement}
## A simple if statement
x <- -2
if(x>0) {
print(x)
} else {
print(-x)
}
if(x>0) {
print(x)
} else if(x==0) {
print(0)
} else {
print(-x)
}
```
```{r for-while}
## For loops
n <- 1000000
x <- rnorm(n, 10, 1)
y <- x^2
y <- rep(0, n)
for(i in 1:n) {
y[i]<-sqrt(x[i])
}
y[1:10]
## While loops
counter <- 1
while(counter<=n) {
y[counter] <- sqrt(x[counter])
counter <- counter+1
}
y[1:10]
```
## Functions and arguments
You can easily create your own function in R. Recommended when you plan to use the same code over and over again.
```{r NR}
## Newton-Raphson to find the square root of a number
MySqrt <- function(y) {
x <- y/2
while (abs(x*x-y) > 1e-10) {
x <- (x+y/x)/2
}
x
}
MySqrt(81)
MySqrt(101)
```
## Vectorized operation
For loops are notoriously slow in R, and whenever possible, it is preferable to use vectorized operations. Most functions in R are already vectorized.
```{r vectorized-ops}
## Let's generate some uniform [0,10] random numbers
n <- 10000
x <- runif(n, 0, 10)
y <- rep(0, n)
library(microbenchmark)
microbenchmark(for(i in 1:n) y[i] <- sqrt(x[i]), sqrt(x), times=10)
```
The for loop is increadibly slower!
While you will often hear that R is slow, there are many ways to speed up calculations in R, often by using third party libraries (e.g. data.table, Rcpp).
## The *apply family
The `*apply` family of functions is intended to try to solve some of the side effects of `for` loops, such as facilitating it's application to R objects (e.g. lists) and improving efficiency.
The most common `*apply` functions are
- `apply`: Returns a vector or array or list of values obtained by applying a function to margins of an array or matrix.
- `lapply`: apply a function or each element of a list or vector
- `sapply`: a user-friendly version and wrapper of lapply by default returning a vector, matrix or, an array. sapply will try to guess what the output should be based on the input.
For more details have a look at [this](http://www.dummies.com/how-to/content/how-to-use-the-apply-family-of-functions-in-r.html).
## Vectorized operation with the *apply family
```{r vectorized-apply}
## Let's generate some uniform [0,10] random numbers
n <- 10000
x <- runif(n, 0, 10)
y <- rep(0, n)
library(microbenchmark)
microbenchmark(for(i in 1:n) y[i] <- MySqrt(x[i]), sapply(x, MySqrt), times=10)
```
`*apply` functions are not necessarily faster than `for` loops, but they can be very convenient and usually lead to more compact and more elegant code.
More efficiency gain can be obtained using compiled code (e.g. C++). R provides multiple ways to call compiled code. In particular, the [Rcpp](http://cran.r-project.org/web/packages/Rcpp/index.html) package can greatly facilitate the use of C++ compiled code.
**Exercise:** Write some code to use the `apply` function on a given matrix.
## Reproducibility and literrate programming
- Approach to programming introduced by Donald Knuth
- An explanation of a program logic in a plain English, interspersed with chunk of computer code.
- Sweave
- Create dynamic reports by embedding R code in latex documents
## knitr vs. Sweave
- Sweave is good but ...
- Writing latex is painful
- Output is limited to pdf
- knitr
- Transparent engine for dynamic report generation
- knitr allows any input languages (e.g. R, Python and Awk) and any output markup languages
## knitr: a feature rich package
- Full control of input, code, and output
- Fine control over how the code is executed and the ouput is displayed
- knitr can process input files in various formats: latex, html, R markdown
- [R markdown](http://www.rstudio.com/ide/docs/authoring/using_markdown.html)
- markdown: easy-to-read, easy-to-write plain text format that can be converted to html
- R markdown: markdown + R code chunks
- [R presentation](http://www.rstudio.com/ide/docs/presentations/overview)
- knitr is readily accessible in RStudio
## Markdown
Markdown is a simple markup language similar to wiki markups
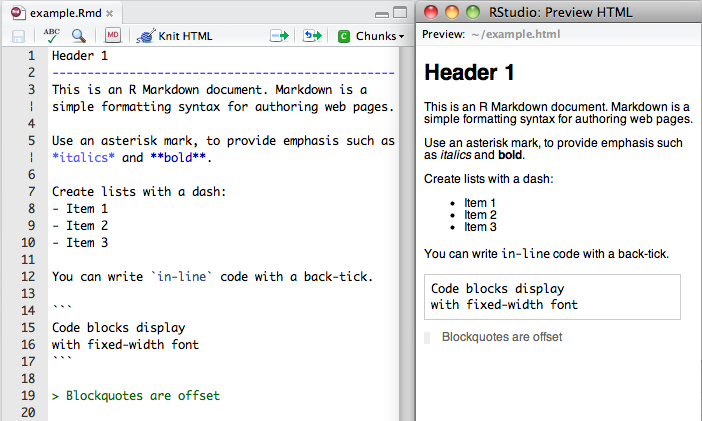
## R Markdown
Mardown with R code chuncks.
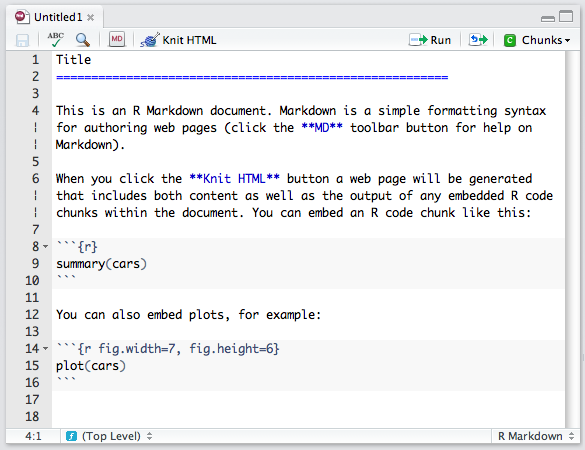
## R Markdown
As we've seen, R expressions can also be evaluated inline:
pi=`r pi`
## knitr and caching
Large data and complex analysis can require significant computing time
- Not unusual for an analysis to take a few minutes to an hour, or even more!
- This can result in some performance issues when viewing a report -> User frustration
- Why rerun a script when nothing has changed?
- The solution is caching
## knitr and caching
knitr provides powerful caching mechanism:
- cache can be turned on/off for each code chunk
- If caching is on, knitr will check if the code has changed when rerunning a report
- Chunks can be made dependent
- The caching mechanism is flexible can be attached to an R version, an input dataset, a date, etc.
## Want to know more about knitr?
<div class="columns-2">
Visit Yihui's webpage: http://yihui.name/knitr/
or buy his book

</div>
## Time for you to work!
What you need to do:
- Download [R](r-project.org) and [RStudio](rstudio.org)
- Signup for an account on [GitHub](github.com).
- Set up your first repository!
- Try [knitr](yihui.name/knitr/) and git within [RStudio](rstudio.org)
We will use RStudio, GitHub and knitr a whole lot throughout this course!
I expect your to use GitHub/knitr/Rstudio for your homeworks and final project!