Data shapes our lives in many ways. Browsing history determines what ads we see and what stories appear in our news feeds. Financial data, aggregated into our credit scores, impacts our livelihoods, including whether we’re eligible for loans—and the interest rates we’ll pay if we are. Genomic data tells us what diseases we might have a genetic predisposition toward.
Our data-driven world doesn’t affect everyone equally. Data has historically been used against communities of color, for example. Starting in the 1930s and continuing through the late 1960s, the Federal Housing Administration mapped predominantly Black American neighborhoods and marked them in red. That data was used to systematically deny mortgage insurance for homes in Black American communities, effectively blocking Black Americans from home ownership and the opportunity to accumulate wealth. The impact of this practice, known as “redlining,” is still felt today. The average homeowner in redlined neighborhoods gained 52% less wealth through property value—$212,023, on average—over the past 40 years than homeowners in other neighborhoods according to Redfin.
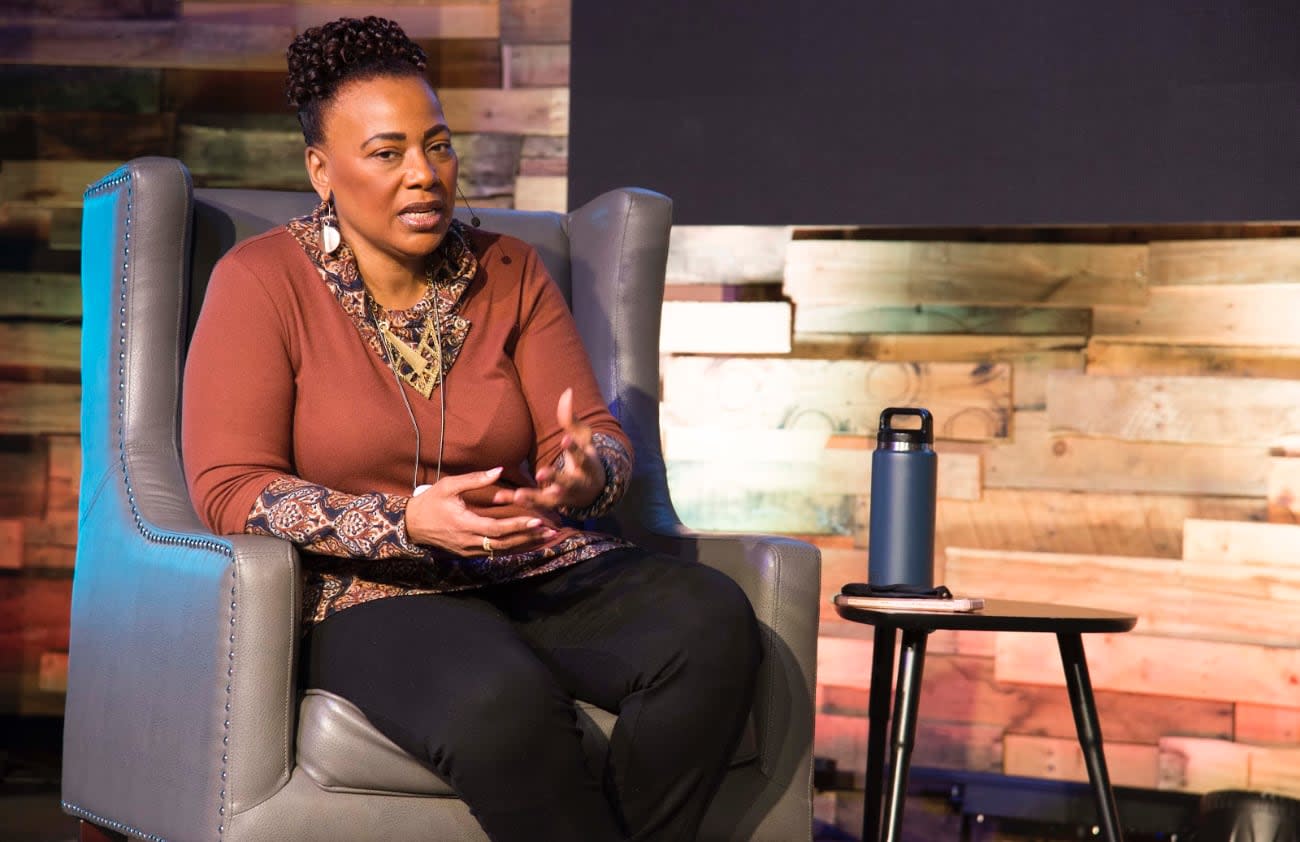
Data-driven harm is often unintentional. Training a machine-learning algorithm with biased data sets creates “algorithmic bias” and reinforces existing injustices. “Technology reflects who we are,” said Bernice King, the CEO of The King Center for Nonviolent Social Change, at a GitHub event in February. “We're recreating the whole world that we currently have with all of the inequities.”
More context and more diverse perspectives are required to combat this trend. “We should not treat data as if it has been collected in a vacuum separate from society nor should we assume that algorithms are inherently fair or equitable simply because they are not human,” says Jamelle Watson, Director of Research at Data for Black Lives, a community of mathematicians, activists, and organizers using data science to help Black American communities.
Data for Black Lives is part of a growing movement focused on giving Black Americans a seat at the table for all types of data-related activities, from collection to interpretation to application. “Our goal is to reclaim data narratives while being mindful of the potential harms that can come from not anticipating the ways certain types of data can be weaponized against Black people,” Watson says.
There’s a long history, dating back at least to WEB Du Bois, of using data to help Black American communities. But the centrality of data in modern life, along with the growing availability of datasets and tools, has made this movement more urgent than ever.
Data without context can also hurt Black American communities. For example, the Centers for Disease Control revealed last year that Black American COVID-19 patients accounted for 33.1% of hospitalizations in the US, even though only 13.4% of the population is Black. White patients, meanwhile, accounted for 45% of hospitalizations despite accounting for 61.1% of the population.
“We saw harmful and uninformed narratives being attached to the data,” says Watson. Some suggested Black people may have some genetic predisposition to the virus, or that they’re disregarding social distancing protocols. "Many claim that Black people are hospitalized more frequently than whites because Black people have higher rates of chronic pre-existing conditions.”
The problem is that the data wasn’t being considered, as Watson puts it, “in the proper historical context considering the various elements of structural racism that shape the American public health ecosystem.” There are a variety of reasons that COVID-19 disproportionately harmed Black Americans, including unequal access to health care, healthy food, and education. Each of these issues exacerbates the other. Ignoring the bigger picture leads people to infer the wrong message from the data.
This gulf between having data and interpreting the information highlights the need for more inclusion in data-related fields and giving those communities more power to shape how data is understood and used.
BlackInData is a community that aims to increase inclusivity by helping students, researchers, and professionals interested in data connect with each other and share resources. “ is not just about data science or AI,” says Markia Smith, a volunteer and third-year PhD student in Pathobiology and Translational Science. “Lots of fields lack representation, including data engineering, data analysis, and data visualization.”
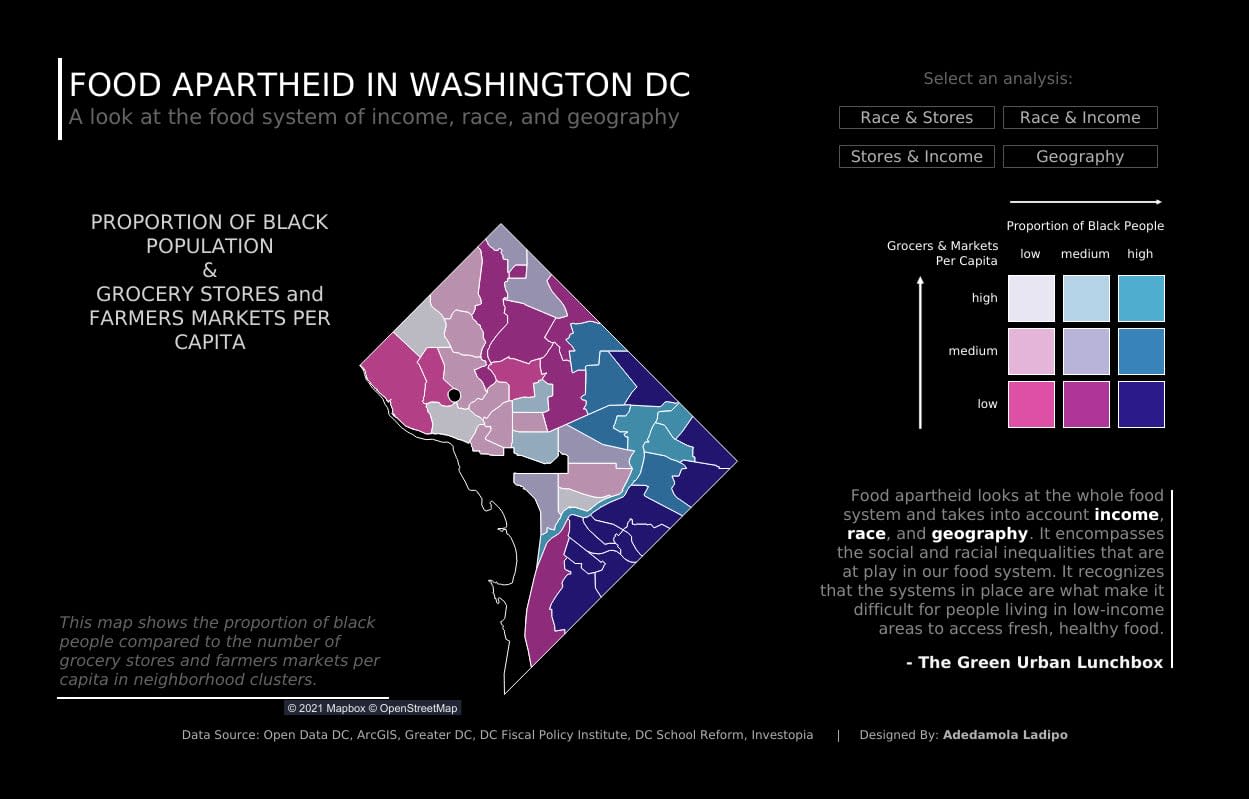
In many cases, it takes someone from a particular community to know what data to collect or analyze in the first place. For example, it might be obvious to communities of color in Washington, D.C. that their neighborhoods have fewer grocery stores than white-dominated neighborhoods. But a data visualization created by Adedamola Ladipo, a DC-based data visualization specialist, demonstrates the severity. “I got a lot of feedback from people who had no idea this was happening,” he says.
“Being Black, I have a different perspective others might not have.”
Democratizing data access
Even as more data is published, access to data remains a challenge. Data for Black Lives launched its COVID-19 Data Tracker last April to help more people access state-level data about how COVID-19 affects different races and ethnicities. But aggregating that data proved difficult. When the organization started the project, only 12 states were reporting data on COVID-19 related cases and deaths disaggregated by race. Now all 50 states have made data sets available thanks to a campaign led by Data for Black Lives.
But challenges remain. For example there was no uniformity in how demographic data was presented. Some states released CSV or Excel files, while others published PDFs. Watson started manually poring over the data and entering them into a spreadsheet. Then, as more states started releasing data, Data for Black Lives volunteers began building tools to automate the collection. It hasn’t been easy—for example, when reporting standards change, volunteers have to adapt their automated tools. The group released its data collection tools on GitHub so anyone can help improve them, or adapt them to other uses.
Improving access to data is a big priority for Data for Black Lives. The group has called for technology companies to release anonymized data sets, instead of hoarding that data internally, so that a more diverse group of activists and researchers can find innovative new ways to leverage data that might not be discovered otherwise.
Entrepreneur Angela Benton is taking a different approach to surfacing data. Her company Streamlytics is tackling a chronic problem for artificial intelligence applications and many other data-driven fields: finding large data sets that are actually representative of the larger population.
Once focused on entertainment streaming, Streamlytics is now expanding to connect people to consumer data they wouldn’t be able to access otherwise. If big tech companies won’t release their data sets to researchers and activists, Streamlytics is offering their users financial incentives to create new ones. If you’re a consumer, the company’s tools help you aggregate your data across the different companies and websites you use, and turn it into a format that you can sell to businesses or researchers. The idea is to put consumers in control of how and where their data is used, understand how much it’s worth—and pay them a fair market rate for it. “Part of the issue that exists is people saying ‘your data isn’t worth much,’” Benton says. “But then you have companies making trillions of dollars off of it.”

More seats at the data table
As we’ve seen with the release of the COVID-19 report, data is often interpreted unfairly through existing systems. Other times, people don’t quite recognize what’s right beneath their noses.
That’s why inclusion is so important in the data space. BlackInData formed last year and hosted their first online conference in November, #BlackInDataWeek. The multi-day event offered dozens of free sessions on a wide range of topics, from discussions about using data in social justice to tutorials on machine learning. The “Data analytics careers after 40” session hosted by Kimberly Deas provided guidance to older professionals looking to learn new skills.
GitHub support specialist Nikkia Ballantyne says more formal organizations like BlackInData and Black in AI as well as less formal, hashtag-based communities like #datafam are an important way to help marginalized communities get involved. “It’s a really welcoming community,” says Ballantyne. That said, it can be intimidating to get started. For example, she says there is a notion that students shouldn’t call themselves data scientists if they don’t have a doctorate. “You shouldn’t be telling someone who can’t even afford community college that you can’t be a data scientist without a PhD,” Ballantyne says.
Blossom Onunekwu, a BlackInData volunteer who has a degree in public health, agrees. “I shied away from data science for a long time because I thought I had to go to a very expensive school and study computer science,” she says. “But in reality, you don’t need a PhD or an expensive bootcamp. Yes, that could help, but there are other paths.” Onunekwu, for example, taught herself about data science using free resources on YouTube and inexpensive Udemy classes. “Spend some time on Twitter, Reddit, and Medium and just see what’s out there,” she suggests.
This explosion of online resources—from courses to datasets to communities—is making it possible for Black American communities to engage with data in ways that would have been impossible only a fewars ago. There’s a lot of work to be done. But these researchers, students, educators, and activists are showing the way forward.
