Amplifying Black folx in
#informatics,#datascience, &#codingaround the world
Follow along via the #BlackInDataWeek hashtag.
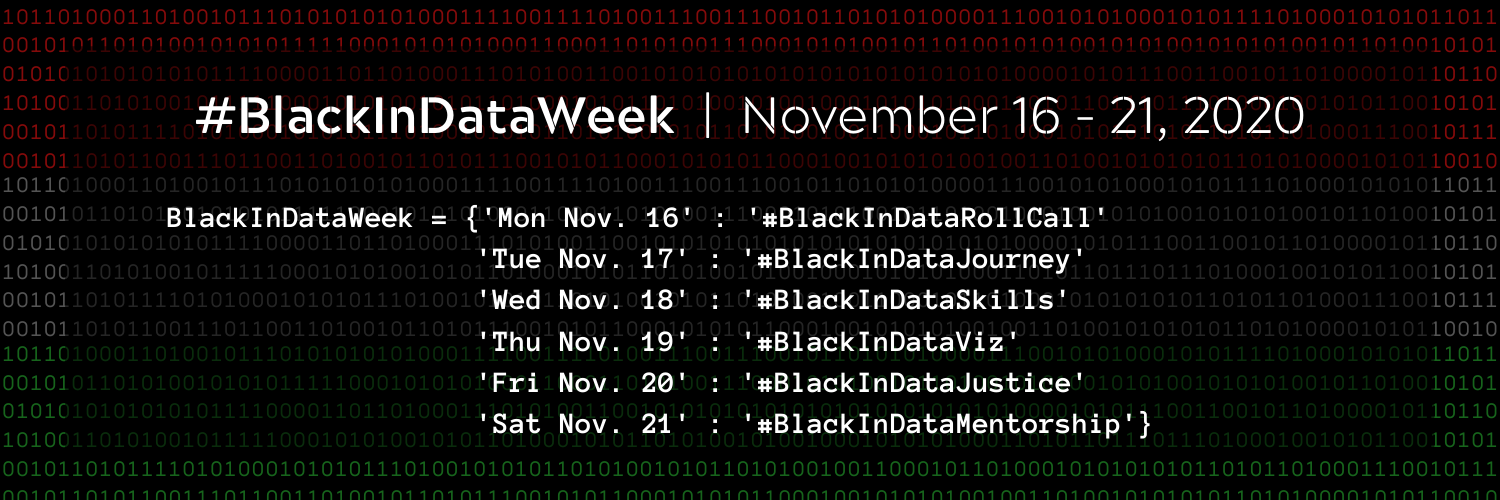
A week-long celebration #BlackInDataWeek to:
- (1) highlight the valuable work and experiences of Black people in the field of Data
- (2) provide community
- (3) educational and professional resources.
To sign up for events, click here!
To learn more about #BlackInDataWeek, please see their website.
The #TidyTuesday community will be taking a break from our own data this week and asking you to engage with, promote, and support Black people in data.
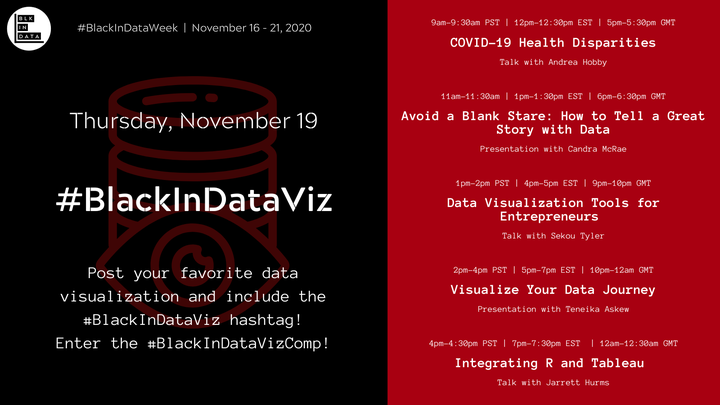
You're welcome to revisit older datasets from #TidyTuesday this week, but especially on Thursday Nov 19th, please create space and engage with the #BlackInDataViz hashtag on Twitter rather than promoting your own work.
From the #BlackInDataViz website:
Creating space for Black people in data to share their work in the form of favourite data visualisation images. Also hosting a competition for data visualisation using a shared dataset, further reinforcing community. We will also host a ‘Data Viz in a Day' skills workshop, focusing on instructing beginners on creating data visualizations.
We don't have our own dataset this week, but the data below returns the purpose, date, hashtag, and link to each day's events to follow along with.
# Get the Data

# Read in with tidytuesdayR package
# Install from CRAN via: install.packages("tidytuesdayR")
# This loads the readme and all the datasets for the week of interest

# Either ISO-8601 date or year/week works!

tuesdata <- tidytuesdayR::tt_load('2020-11-17')
tuesdata <- tidytuesdayR::tt_load(2020, week = 47)

black_in_data <- tuesdata$black_in_data

# Or read in the data manually

black_in_data <- readr::read_csv('https://raw.githubusercontent.com/rfordatascience/tidytuesday/main/data/2020/2020-11-17/black_in_data.csv')
| variable | class | description |
|---|---|---|
| date | date | Date of Event |
| hashtag | character | Hashtag for specific event |
| purpose | character | Purpose of event |
| link | character | URL/Link to the event page |
black_in_data <- data.frame(
  date = seq(as.Date("2020-11-16"), as.Date("2020-11-21"), 1),
  hashtag = c("#BlackInDataRollCall",
              "#BlackInDataJourney",
              "#BlackInDataSkills",
              "#BlackInDataViz",
              "#BlackInDataJustice",
              "#BlackInDataMentorship"),
  purpose = c(
    "Giving Black people in data a space to introduce themselves and their work. Introducing and valuing intersecting parts of their identities. We welcome contributions from a wide spectrum of Data Fields including but not limited to Informatics, Technology, Data Science, Coding, Social Science and Data Analytics.",
    "Further fostering community for Black people in data, by encouraging them to share their varied journeys in data.",
    "Discussing the skills Black people in data have learned, communal sharing of resources and advice for skills development.",
    "Creating space for Black people in data to share their work in the form of favourite data visualisation images.",
    "Hosting forums for learning and discussion of bias in the data field (and possible paths to address biases in data).",
    "Join us for career development and mentorship events!"
  ),
  link = c(
    "https://blkindata.github.io/project/blackindatarollcall/",
    "https://blkindata.github.io/project/blackindatajourney/",
    "https://blkindata.github.io/project/blackindataskills/",
    "https://blkindata.github.io/project/blackindataviz/",
    "https://blkindata.github.io/project/blackindatajustice/",
    "https://blkindata.github.io/project/blackindatacommunity/"
  )
)

