This repository provides a GitHub Action for continuous benchmarking. If your project has some benchmark suites, this action collects data from the benchmark outputs and monitor the results on GitHub Actions workflow.
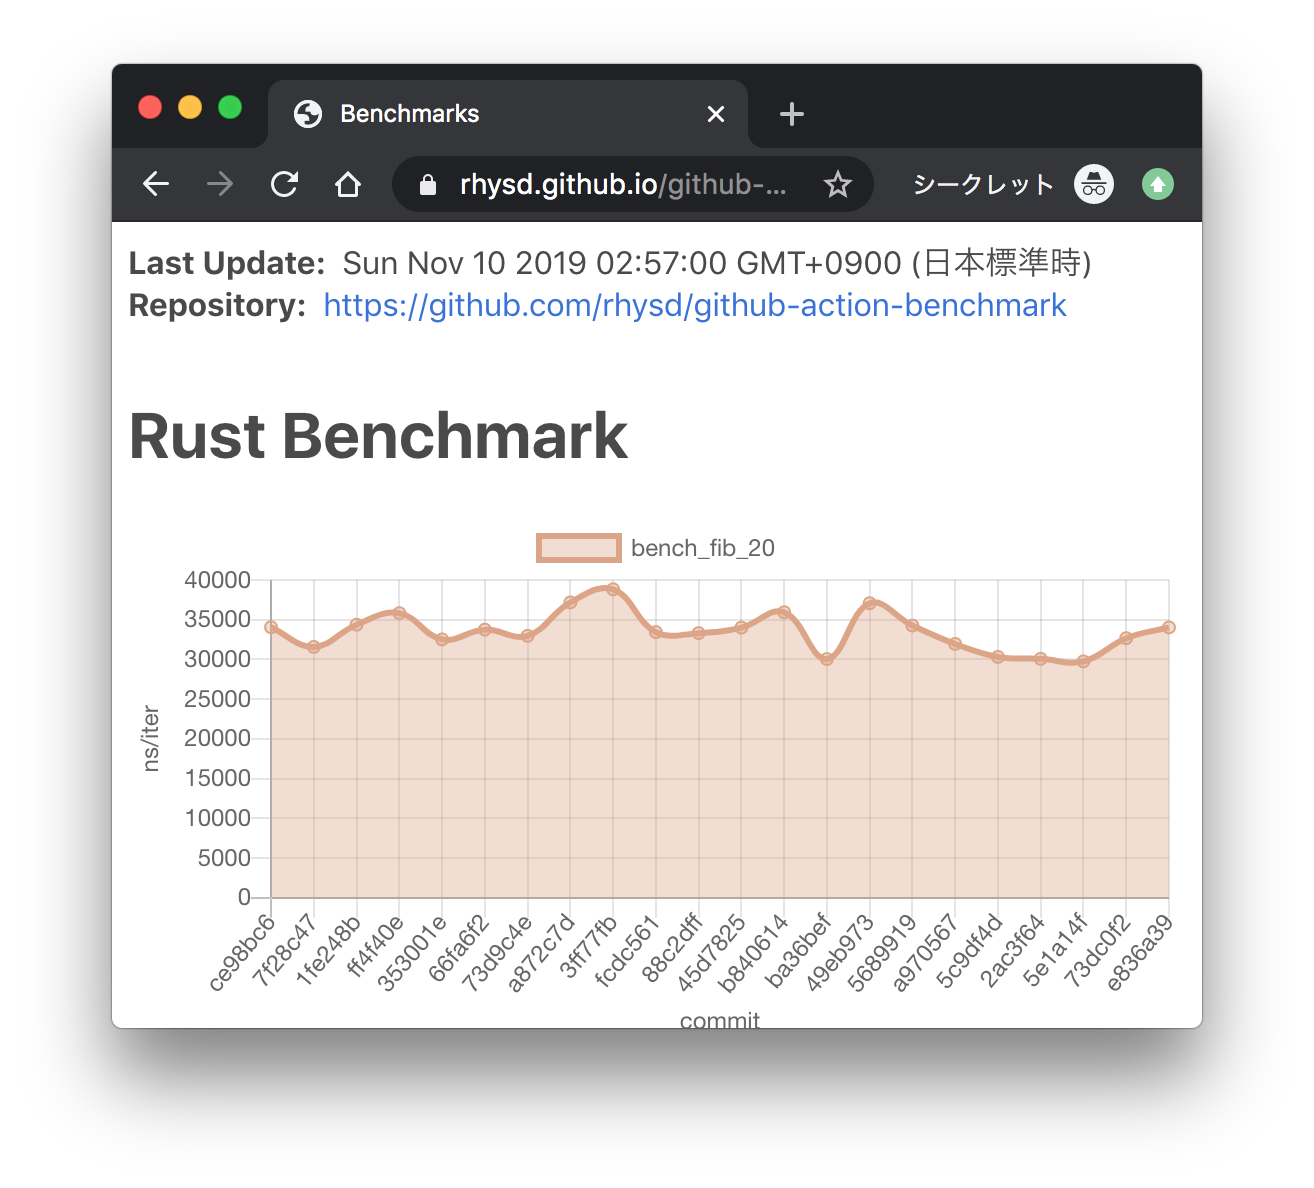
- This action can store collected benchmark results in GitHub pages branch and provide a chart view. Benchmark results are visualized on the GitHub pages of your project.
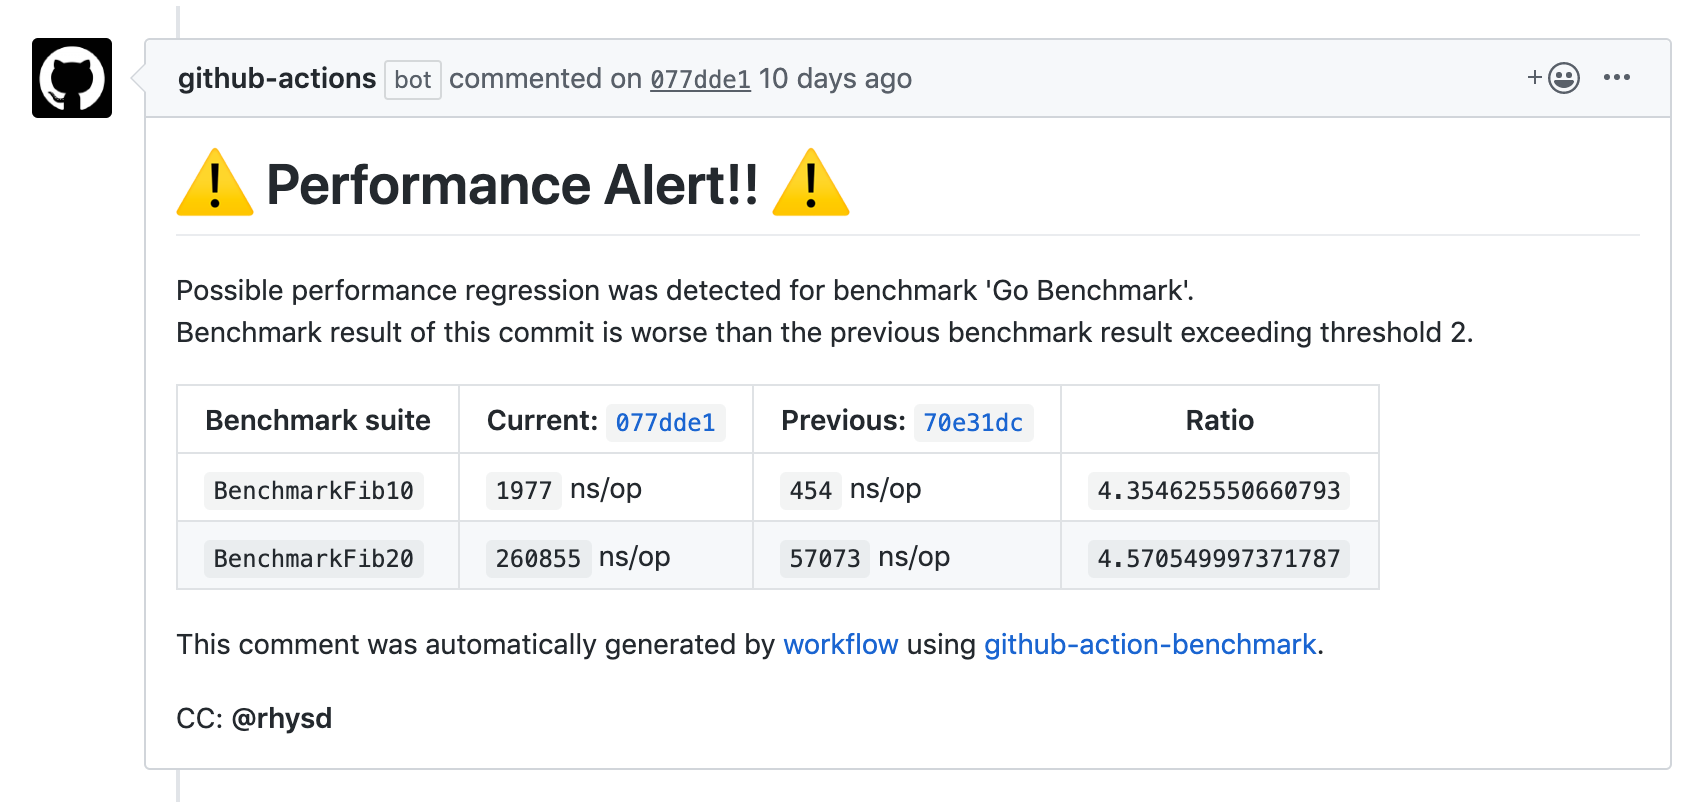
- This action can detect possible performance regressions by comparing benchmark results. When benchmark results get worse than previous exceeding the specified threshold, it can raise an alert via commit comment or workflow failure.
This action currently supports the following tools:
cargo benchfor Rust projectsgo test -benchfor Go projects- benchmark.js for JavaScript/TypeScript projects
- pytest-benchmark for Python projects with pytest
- Google Benchmark Framework for C++ projects
- Catch2 for C++ projects
- BenchmarkTools.jl for Julia packages
- Benchmark.Net for .Net projects
- benchmarkluau for Luau projects
- JMH for Java projects
- Custom benchmarks where either 'biggerIsBetter' or 'smallerIsBetter'
Multiple languages in the same repository are supported for polyglot projects.
Example projects for each language are in examples/ directory. Live example workflow definitions are in .github/workflows/ directory. Live workflows are:
| Language | Workflow | Example Project |
|---|---|---|
| Rust | examples/rust | |
| Go | examples/go | |
| JavaScript | examples/benchmarkjs | |
| Python | examples/pytest | |
| C++ | examples/cpp | |
| C++ (Catch2) | examples/catch2 | |
| Julia | examples/julia | |
| .Net | examples/benchmarkdotnet | |
| Java | examples/java | |
| Luau | Coming soon | Coming soon |
All benchmark charts from above workflows are gathered in GitHub pages:
https://benchmark-action.github.io/github-action-benchmark/dev/bench/
Additionally, even though there is no explicit example for them, you can use
customBiggerIsBetter and customSmallerIsBetter to use this
action and create your own graphs from your own benchmark data. The name in
these tools define which direction "is better" for your benchmarks.
Every entry in the JSON file you provide only needs to provide name, unit,
and value. You can also provide optional range (results' variance) and
extra (any additional information that might be useful to your benchmark's
context) properties. Like this:
[
    {
        "name": "My Custom Smaller Is Better Benchmark - CPU Load",
        "unit": "Percent",
        "value": 50
    },
    {
        "name": "My Custom Smaller Is Better Benchmark - Memory Used",
        "unit": "Megabytes",
        "value": 100,
        "range": "3",
        "extra": "Value for Tooltip: 25\nOptional Num #2: 100\nAnything Else!"
    }
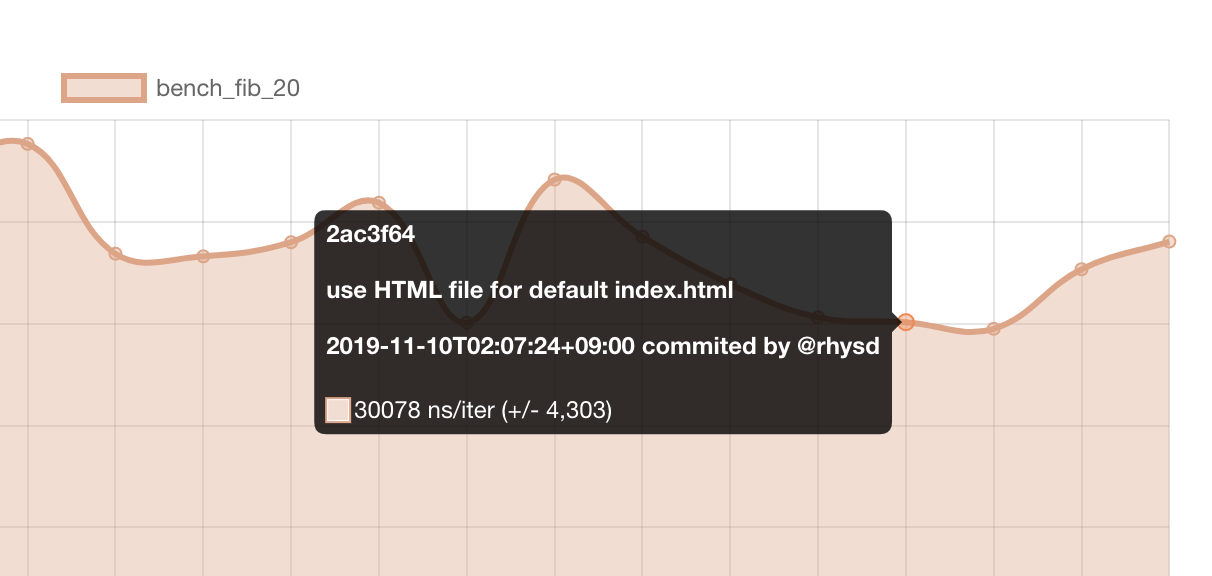
]Mouseover on data point shows a tooltip. It includes
- Commit hash
- Commit message
- Date and committer
- Benchmark value
Clicking data point in chart opens the commit page on a GitHub repository.
At bottom of the page, the download button is available for downloading benchmark results as a JSON file.
This action can raise an alert comment. to the commit when its benchmark results are worse than previous exceeding a specified threshold.
Since performance is important. Writing benchmarks is a popular and correct way to visualize a software performance. Benchmarks help us to keep performance and to confirm the effects of optimizations. For keeping the performance, it's important to monitor the benchmark results along with changes to the software. To notice performance regression quickly, it's useful to monitor benchmarking results continuously.
However, there is no good free tool to watch the performance easily and continuously across languages (as far as I looked into). So I built a new tool on top of GitHub Actions.
This action takes a file that contains benchmark output. And it outputs the results to GitHub Pages branch and/or alert commit comment.
Let's start with a minimal workflow setup. For explanation, here let's say we have a Go project. But basic setup is the same when you use other languages. For language-specific setup, please read the later section.
name: Minimal setup
on:
  push:
    branches:
      - master

jobs:
  benchmark:
    name: Performance regression check
    runs-on: ubuntu-latest
    steps:
      - uses: actions/checkout@v4
      - uses: actions/setup-go@v4
        with:
          go-version: "stable"
      # Run benchmark with `go test -bench` and stores the output to a file
      - name: Run benchmark
        run: go test -bench 'BenchmarkFib' | tee output.txt
      # Download previous benchmark result from cache (if exists)
      - name: Download previous benchmark data
        uses: actions/cache@v4
        with:
          path: ./cache
          key: ${{ runner.os }}-benchmark
      # Run `github-action-benchmark` action
      - name: Store benchmark result
        uses: benchmark-action/github-action-benchmark@v1
        with:
          # What benchmark tool the output.txt came from
          tool: 'go'
          # Where the output from the benchmark tool is stored
          output-file-path: output.txt
          # Where the previous data file is stored
          external-data-json-path: ./cache/benchmark-data.json
          # Workflow will fail when an alert happens
          fail-on-alert: true
      # Upload the updated cache file for the next job by actions/cache
The step which runs github-action-benchmark does followings:
- Extract benchmark result from the output in
output.txt - Update the downloaded cache file with the extracted result
- Compare the result with the previous result. If it gets worse than previous exceeding 200% threshold, the workflow fails and the failure is notified to you
By default, this action marks the result as performance regression when it is worse than the previous
exceeding 200% threshold. For example, if the previous benchmark result was 100 iter/ns and this time
it is 230 iter/ns, it means 230% worse than the previous and an alert will happen. The threshold can
be changed by alert-threshold input.
A live workflow example is here. And the results of the workflow can be seen here.
In addition to the above setup, GitHub API token needs to be given to enable comment-on-alert feature.
- name: Store benchmark result
  uses: benchmark-action/github-action-benchmark@v1
  with:
    tool: 'go'
    output-file-path: output.txt
    external-data-json-path: ./cache/benchmark-data.json
    fail-on-alert: true
    # GitHub API token to make a commit comment
    github-token: ${{ secrets.GITHUB_TOKEN }}
    # Enable alert commit comment
    comment-on-alert: true
    # Mention @rhysd in the commit comment
    alert-comment-cc-users: '@rhysd'
secrets.GITHUB_TOKEN is a GitHub API token automatically generated for each workflow run.
It is necessary to send a commit comment when the benchmark result of the commit is detected as possible
performance regression.
Now, in addition to making workflow fail, the step leaves a commit comment when it detects performance
regression like this. Though alert-comment-cc-users input is not mandatory for
this, I recommend to set it to make sure you can notice the comment via GitHub notification. Please note
that this value must be quoted like '@rhysd' because @ is an indicator in YAML syntax.
A live workflow example is here. And the results of the workflow can be seen here.
Similar to the Commit comment feature, Github Actions Job Summaries are
also supported. In order to use Job Summaries, turn on the summary-always
option.
- name: Store benchmark result
  uses: benchmark-action/github-action-benchmark@v1
  with:
    tool: 'cargo'
    output-file-path: output.txt
    external-data-json-path: ./cache/benchmark-data.json
    fail-on-alert: true
    # GitHub API token to make a commit comment
    github-token: ${{ secrets.GITHUB_TOKEN }}
    # Enable alert commit comment
    comment-on-alert: true
    # Enable Job Summary for PRs
    summary-always: true
    # Mention @rhysd in the commit comment
alert-comment-cc-users: '@rhysd'It is useful to see how the benchmark results changed on each change in time-series charts. This action provides a chart dashboard on GitHub pages.
It requires some preparations before the workflow setup.
You need to create a branch for GitHub Pages if you haven't created it yet.
# Create a local branch
$ git checkout --orphan gh-pages
# Push it to create a remote branch
$ git push origin gh-pages:gh-pages
Now you're ready for workflow setup.
# Do not run this workflow on pull request since this workflow has permission to modify contents.
on:
  push:
    branches:
      - master

permissions:
  # deployments permission to deploy GitHub pages website
  deployments: write
  # contents permission to update benchmark contents in gh-pages branch
  contents: write

jobs:
  benchmark:
    name: Performance regression check
    runs-on: ubuntu-latest
    steps:
      - uses: actions/checkout@v4
      - uses: actions/setup-go@v4
        with:
          go-version: "stable"
      # Run benchmark with `go test -bench` and stores the output to a file
      - name: Run benchmark
        run: go test -bench 'BenchmarkFib' | tee output.txt
      # gh-pages branch is updated and pushed automatically with extracted benchmark data
      - name: Store benchmark result
        uses: benchmark-action/github-action-benchmark@v1
        with:
          name: My Project Go Benchmark
          tool: 'go'
          output-file-path: output.txt
          # Access token to deploy GitHub Pages branch
          github-token: ${{ secrets.GITHUB_TOKEN }}
          # Push and deploy GitHub pages branch automatically
          auto-push: true
The step which runs github-action-benchmark does followings:
- Extract benchmark result from the output in
output.txt - Switch branch to
gh-pages - Read existing benchmark results from
dev/bench/data.js - Update
dev/bench/data.jswith the extracted benchmark result - Generate a commit to store the update in
gh-pagesbranch - Push
gh-pagesbranch to remote - Compare the results with previous results and make an alert if possible performance regression is detected
After the first workflow run, you will get the first result on https://you.github.io/repo/dev/bench
like this.
By default, this action assumes that gh-pages is your GitHub Pages branch and that /dev/bench is
a path to put the benchmark dashboard page. If they don't fit your use case, please tweak them by
gh-pages-branch, gh-repository and benchmark-data-dir-path inputs.
This action merges all benchmark results into one GitHub pages branch. If your workflows have multiple
steps to check benchmarks from multiple tools, please give name input to each step to make each
benchmark results identical.
Please see the above 'Examples' section to see live workflow examples for each language.
If you don't want to pass GitHub API token to this action, it's still OK.
- name: Store benchmark result
  uses: benchmark-action/github-action-benchmark@v1
  with:
    name: My Project Go Benchmark
    tool: 'go'
    output-file-path: output.txt
    # Set auto-push to false since GitHub API token is not given
    auto-push: false
# Push gh-pages branch by yourself
- name: Push benchmark result
  run: git push 'https://you:${{ secrets.GITHUB_TOKEN }}@github.com/you/repo-name.git' gh-pages:gh-pages
Please add a step to push the branch to the remote.
Please read README.md files at each example directory. Usually, take stdout from a benchmark tool
and store it to file. Then specify the file path to output-file-path input.
cargo benchfor Rust projectsgo testfor Go projects- Benchmark.js for JavaScript/TypeScript projects
- pytest-benchmark for Python projects with pytest
- Google Benchmark Framework for C++ projects
- catch2 for C++ projects
- BenchmarkTools.jl for Julia projects
- Benchmark.Net for .Net projects
- benchmarkluau for Luau projects - Examples for this are still a work in progress.
These examples are run in workflows of this repository as described in the 'Examples' section above.
Input definitions are written in action.yml.
- Type: String
- Default:
"Benchmark"
Name of the benchmark. This value must be identical across all benchmarks in your repository.
- Type: String
- Default: N/A
Tool for running benchmark. The value must be one of "cargo", "go", "benchmarkjs", "pytest",
"googlecpp", "catch2", "julia", "jmh", "benchmarkdotnet","benchmarkluau", "customBiggerIsBetter", "customSmallerIsBetter".
- Type: String
- Default: N/A
Path to a file which contains the output from benchmark tool. The path can be relative to repository root.
- Type: String
- Default:
"gh-pages"
Name of your GitHub pages branch.
Note: If you're using docs/ directory of master branch for GitHub pages, please set gh-pages-branch
to master and benchmark-data-dir-path to the directory under docs like docs/dev/bench.
- Type: String
Url to an optional different repository to store benchmark results (eg. github.com/benchmark-action/github-action-benchmark-results)
NOTE: if you want to auto push to a different repository you need to use a separate Personal Access Token that has a write access to the specified repository.
If you are not using the auto-push option then you can avoid passing the gh-token if your data repository is public
- Type: String
- Default:
"dev/bench"
Path to a directory that contains benchmark files on the GitHub pages branch. For example, when this value
is set to "path/to/bench", https://you.github.io/repo-name/path/to/bench will be available as benchmarks
dashboard page. If it does not contain index.html, this action automatically generates it at first run.
The path can be relative to repository root.
- Type: String
- Default: N/A
GitHub API access token.
- Type: String
- Default: N/A
Ref to use for reporting the commit
- Type: Boolean
- Default:
false
If it is set to true, this action automatically pushes the generated commit to GitHub Pages branch.
Otherwise, you need to push it by your own. Please read 'Commit comment' section above for more details.
- Type: Boolean
- Default:
false
If it is set to true, this action will leave a commit comment comparing the current benchmark with previous.
github-token is necessary as well.
- Type: Boolean
- Default:
true
If it is set to false, this action will not save the current benchmark to the external data file.
You can use this option to set up your action to compare the benchmarks between PR and base branch.
- Type: String
- Default:
"200%"
Percentage value like "150%". It is a ratio indicating how worse the current benchmark result is.
For example, if we now get 150 ns/iter and previously got 100 ns/iter, it gets 150% worse.
If the current benchmark result is worse than previous exceeding the threshold, an alert will happen.
See comment-on-alert and fail-on-alert also.
- Type: Boolean
- Default:
false
If it is set to true, this action will leave a commit comment when an alert happens like this.
github-token is necessary as well. For the threshold, please see alert-threshold also.
- Type: Boolean
- Default:
false
If it is set to true, the workflow will fail when an alert happens. For the threshold for this, please
see alert-threshold and fail-threshold also.
- Type: String
- Default: The same value as
alert-threshold
Percentage value in the same format as alert-threshold. If this value is set, the threshold value
will be used to determine if the workflow should fail. Default value is set to the same value as
alert-threshold input. This value must be equal or larger than alert-threshold value.
- Type: String
- Default: N/A
Comma-separated GitHub user names mentioned in alert commit comment like "@foo,@bar". These users
will be mentioned in a commit comment when an alert happens. For configuring alerts, please see
alert-threshold and comment-on-alert also.
- Type: String
- Default: N/A
External JSON file which contains benchmark results until previous job run. When this value is set,
this action updates the file content instead of generating a Git commit in GitHub Pages branch.
This option is useful if you don't want to put benchmark results in GitHub Pages branch. Instead,
you need to keep the JSON file persistently among job runs. One option is using a workflow cache
with actions/cache action. Please read 'Minimal setup' section above.
- Type: Number
- Default: N/A
Max number of data points in a chart for avoiding too busy chart. This value must be unsigned integer larger than zero. If the number of benchmark results for some benchmark suite exceeds this value, the oldest one will be removed before storing the results to file. By default this value is empty which means there is no limit.
- Type: Boolean
- Default:
false
If set to true, the workflow will skip fetching branch defined with the gh-pages-branch variable.
No action output is set by this action for the parent GitHub workflow.
Please ensure that your benchmark workflow runs only on your branches. Please avoid running it on pull requests. If a branch were pushed to GitHub pages branch on a pull request, anyone who creates a pull request on your repository could modify your GitHub pages branch.
For this, you can specify a branch that runs your benchmark workflow on on: section. Or set the
proper condition to if: section of step which pushes GitHub pages.
e.g. Runs on only master branch
on:
  push:
    branches:
      - master
e.g. Push when not running for a pull request
- name: Push benchmark result
  run: git push ...
if: github.event_name != 'pull_request'As far as watching the benchmark results of examples in this repository, the amplitude of the benchmarks is about +- 10~20%. If your benchmarks use some resources such as networks or file I/O, the amplitude might be bigger.
If the amplitude is not acceptable, please prepare a stable environment to run benchmarks. GitHub action supports self-hosted runners.
This action creates the default index.html in the directory specified with benchmark-data-dir-path
input. By default, every benchmark test case has own chart on the page. Charts are drawn with
Chart.js.
If it does not fit your use case, please modify the HTML file or replace it with your favorite one.
Every benchmark data is stored in window.BENCHMARK_DATA so you can create your favorite view.
This action conforms semantic versioning 2.0.
For example, benchmark-action/github-action-benchmark@v1 means the latest version of 1.x.y. And
benchmark-action/github-action-benchmark@v1.0.2 always uses v1.0.2 even if a newer version is published.
master branch of this repository is for development and does not work as action.
To notice new version releases, please watch 'release only' at this repository. Every release will appear on your GitHub notifications page.
- Support pull requests. Instead of updating GitHub pages, add a comment to the pull request to explain benchmark results.
- Add more benchmark tools:
- Allow uploading results to metrics services such as mackerel
- Show extracted benchmark data in the output from this action
- Add a table view in dashboard page to see all data points in table
- lighthouse-ci-action is an action for Lighthouse CI. If you're measuring performance of your web application, using Lighthouse CI and lighthouse-ci-action would be better than using this action.


