A Gantt chart is a type of bar chart that illustrates a project schedule. It shows the start and end dates of individual tasks within a project, as well as their dependencies and the overall project timeline. Gantt charts are commonly used in project management to visualize and track progress, allocate resources, and plan project timelines.
In a Gantt Chart, the main components typically include tasks, milestones, start and end dates, and dependencies. Each of these components plays a crucial role in visualizing and managing the project timeline. Here's a brief explanation of each component:
-
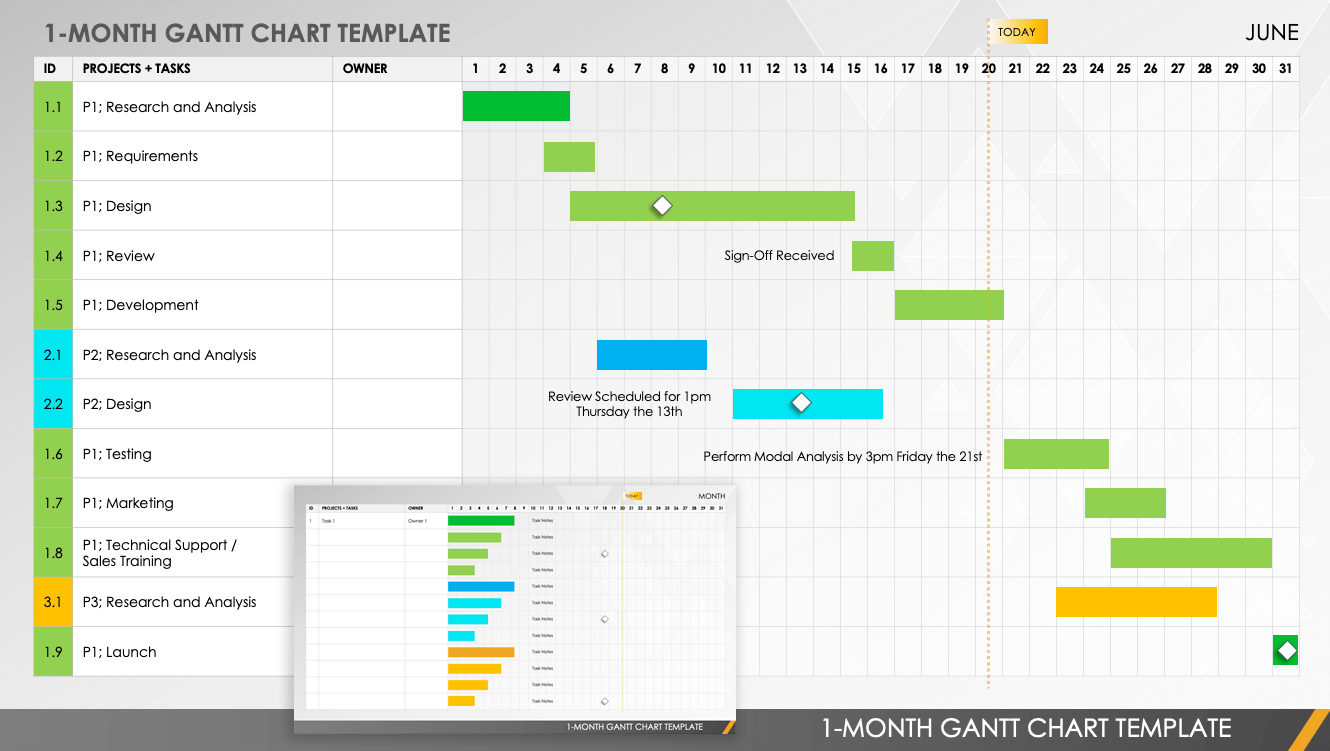
Tasks: Tasks represent the individual activities or work items that need to be completed as part of the project. In a Gantt Chart, tasks are often displayed as horizontal bars along a timeline, with the length of the bar indicating the duration of the task.
-
Milestones: Milestones are significant points or achievements in a project. They often represent the completion of a phase, the achievement of a key deliverable, or any other important event. Milestones are usually displayed as vertical lines or markers on the Gantt Chart timeline.
-
Start and End Dates: The Gantt Chart includes a timeline that spans from the project's start date to its end date. Each task is positioned along this timeline based on its start and end dates, providing a visual representation of when each task is scheduled to start and finish.
-
Dependencies: Dependencies indicate the relationships between tasks. Some tasks may depend on the completion of others before they can start. Dependencies help in understanding the order in which tasks should be completed to ensure a smooth project flow. Dependencies are often represented by arrows connecting tasks on the Gantt Chart.
-
Duration: The duration of a task is the amount of time it takes to complete. This is often represented by the length of the horizontal bar for each task on the Gantt Chart. The start and end dates, along with dependencies, help determine the overall project timeline.
These components collectively provide a comprehensive visual representation of a project's schedule, allowing project managers and team members to track progress, manage resources, and identify potential issues or delays.
- Use readily available templates i.e. Canva, Excel, Microsoft 365 etc
- List the task activities to be completed in a project
- Estimate the duration for all these activities
- Identify activities cannot begin until other activity/activities has/have been completed (dependencies)
- Identify which activities can run at the same time; this will minimize the time to complete the project
- Prepare the Gantt Chart by placing all tasks in the correct sequence and identifying associated dates or time periods