| Parameter |
Default |
|
| x_min |
-4 |
x-axis min value |
| x_max |
4 |
x-axis max value |
| mean |
0 |
Mean value |
| std |
1 |
Standard deviation value |
| y_max |
0.45 |
y-axix max value |
| xlabel |
'x' |
x-axis label |
| ylabel |
'pdf(x)' |
y-axis label |
| legend_size |
12 |
The legend font size. |
| lb |
-10 |
Lower bound |
| up |
10 |
Upper bound |
| font_size |
20 |
Font size for title |
| alpha |
1 |
Alpha(transparency) value |
| fill_color |
'skyblue' |
Filling color |
| bg_color |
'white' |
Background color |
| title |
None |
Figure title |
| fig_w |
8 |
Matplotlib figsize width |
| fig_l |
8 |
Matplotlib figsize length |
| grid |
True |
Use 'True' or 'False' |
| title_size |
20 |
The x and y-axis title size. |
| label_size |
16 |
The label font size. |
| tick_size |
12 |
The x and y-axis tick size. |
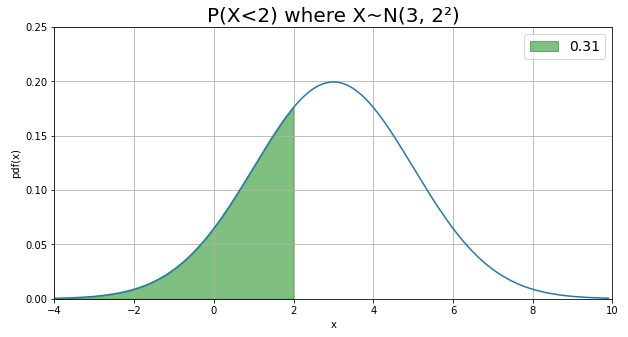
sf. normcdf(x_min=-4, x_max=10, mean=3, std=2, size=8, y_max=0.25,xlabel='x',
            ylabel='pdf(x)', lb=-10, ub=2, font_size=20, alpha=0.5, fill_color='g',
            title='P(X<2) where ')
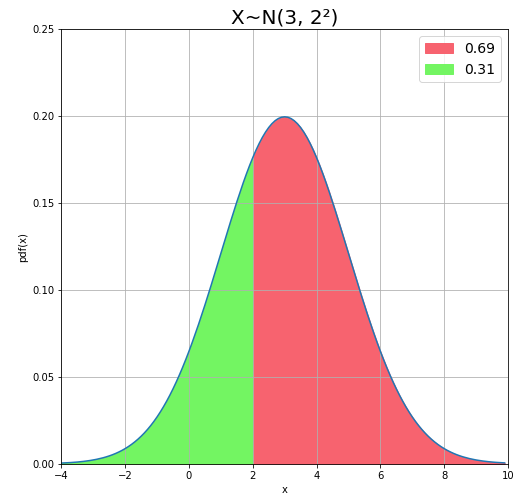
normcdf(x_min=-4, x_max=10, mean=3, std=2, size=8, y_max=0.25,xlabel='x', ylabel='pdf(x)',
        lb=-10, ub=2, font_size=20, fill_color='#73f562', alpha=1, bg_color='#f7636f')
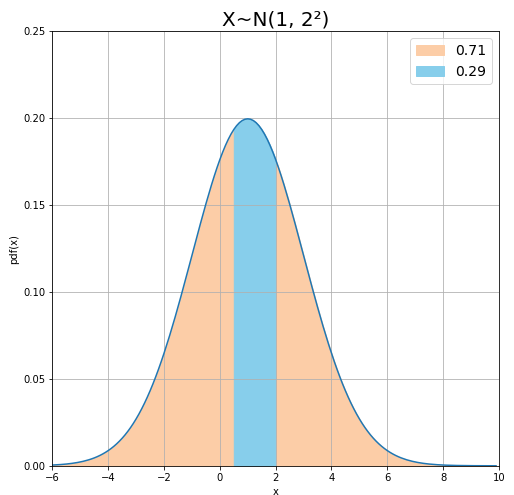
normcdf(mean=1, std=2, lb=0.5, ub=2, y_max=0.25, x_min=-6, x_max=10, bg_color='#fccda7')
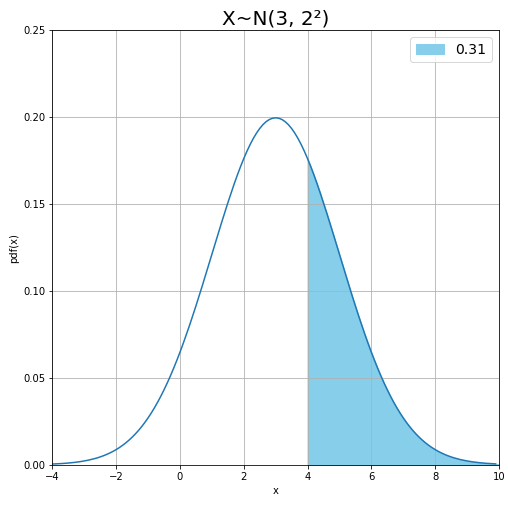
normcdf(mean=3, std=2, lb=4, ub=10, y_max=0.25, x_min=-4, x_max=10)
| Parameter |
Default |
|
| val |
[1,2,3,4] |
The Degree of freedom values to display. |
| x_min |
-4 |
x-axis min value |
| x_max |
4 |
x-axis max value |
| y_max |
0.45 |
y-axix max value |
| xlabel |
'x' |
x-axis label |
| ylabel |
'pdf(x)' |
y-axis label |
| legend_size |
12 |
The legend font size. |
| font_size |
20 |
Font size for title |
| title |
None |
Figure title |
| fig_w |
8 |
Matplotlib figsize width |
| fig_l |
8 |
Matplotlib figsize length |
| grid |
True |
Use 'True' or 'False' |
| title_size |
20 |
The x and y-axis title size. |
| label_size |
16 |
The label font size. |
| tick_size |
12 |
The x and y-axis tick size. |
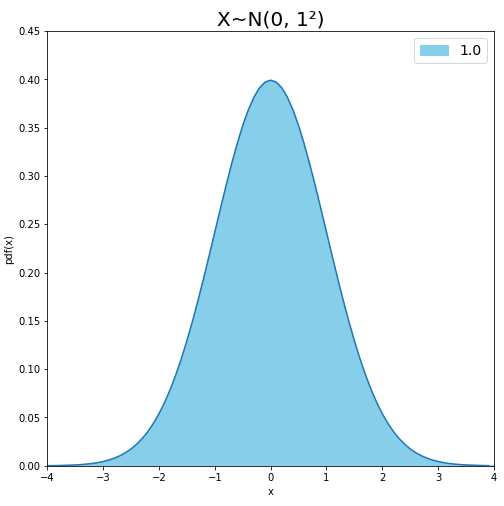
import statfig as sf

sf.normpdf_std()
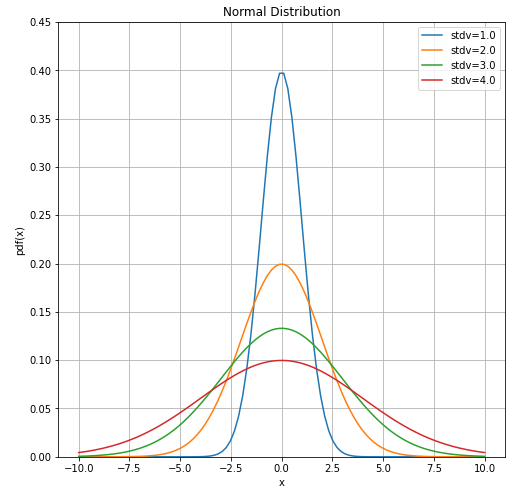
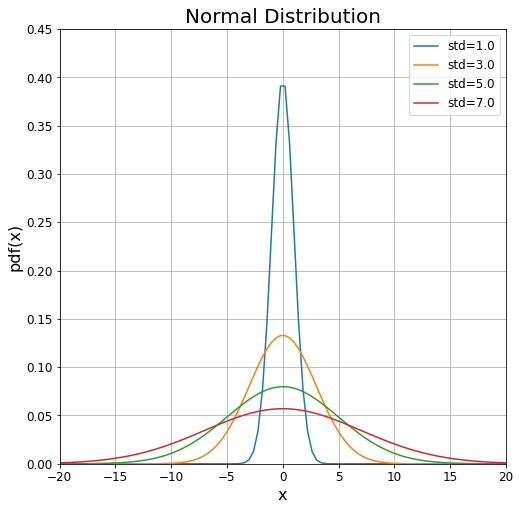
normpdf_std(val=[1,3,5,7], x_min=-20, x_max=20, y_max=0.45)
| Parameter |
Default |
|
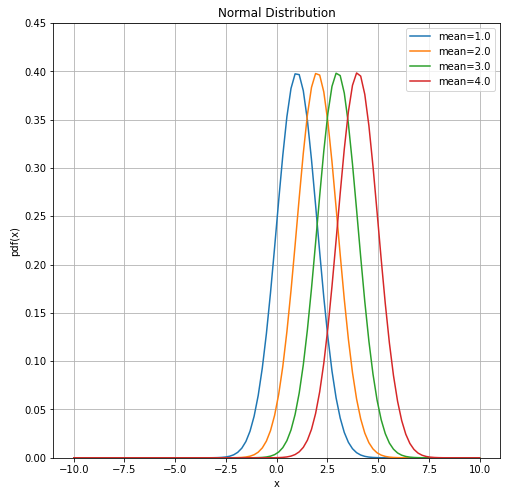
| val |
[0,1,2,3] |
The Mean values to display. |
| x_min |
-4 |
x-axis min value |
| x_max |
4 |
x-axis max value |
| y_max |
0.45 |
y-axix max value |
| xlabel |
'x' |
x-axis label |
| ylabel |
'pdf(x)' |
y-axis label |
| legend_size |
12 |
The legend font size. |
| font_size |
20 |
Font size for title |
| title |
None |
Figure title |
| fig_w |
8 |
Matplotlib figsize width |
| fig_l |
8 |
Matplotlib figsize length |
| grid |
True |
Use 'True' or 'False' |
| title_size |
20 |
The x and y-axis title size. |
| label_size |
16 |
The label font size. |
| tick_size |
12 |
The x and y-axis tick size. |
import statfig as sf

sf.normpdf_mean()