Multi Measure Munki (mmmunki) is a console utility for working with the X-Rite Colormunki Photo spectrophotometer. It allows you to use this device to measure the color charts used for profiling printing devices and to measure the spectrum and color temperature of light sources.
- Overview
- Usage
- Examples
- Sample profiling routine using Argyll CMS
- About selecting the best measurement
The software that comes with Colormunki Photo has very limited capabilities for generating and measuring color charts: it allows you to use only one-page cards with 50 patches of large size per sheet. Measurement of light sources is not provided at all.
The sensor of the Colormunki Photo spectrophotometer is almost the same as that of the much more expensive i1Pro 2, but its reading frequency is about 10 times less. Therefore, it requires larger patches and overall measurement accuracy is lower. Another drawback of Colormunki Photo is the smaller buffer memory for storing readings. Therefore, if you try to measure a strip with a large number of patches and move the device slowly to increase the number of reads, the buffer may overflow and some data will be lost.
This utility allows you to bypass all these restrictions.
Firstly, it makes it possible to measure any color charts (including multipage) generated in programs that have the ability to save reference tables in text format (Argyll CMS, Profile Maker 5, i1Profiler). The obtained measurement results are also saved in text format. This allows you to use these programs to build profiles of printing devices based on this data.
Secondly, the utility allows using patches of substantially smaller size in color charts without loss of accuracy. The minimum patch size is approximately 11x12 mm, which allows you to place up to 546 patches on an A4 sheet. This is achieved through the ability to measure each strip many times. Then the values that best match certain criteria are selected for each patch.
Thirdly, in order to avoid buffer overflow, the utility allows you to break a strip with patches into fragments and read one fragment per pass. Then the data for each fragment are combined into a strip.
All of this allows to significantly reducing the consumption of expensive paper and ink without loss of measurement accuracy.
In addition, the utility has a special mode that allows you to measure the spectrum and color temperature of light sources with recording data to a file. The obtained data can be used, for example, in an online calculator to calculate the actual color rendition index (CRI) of the light source.
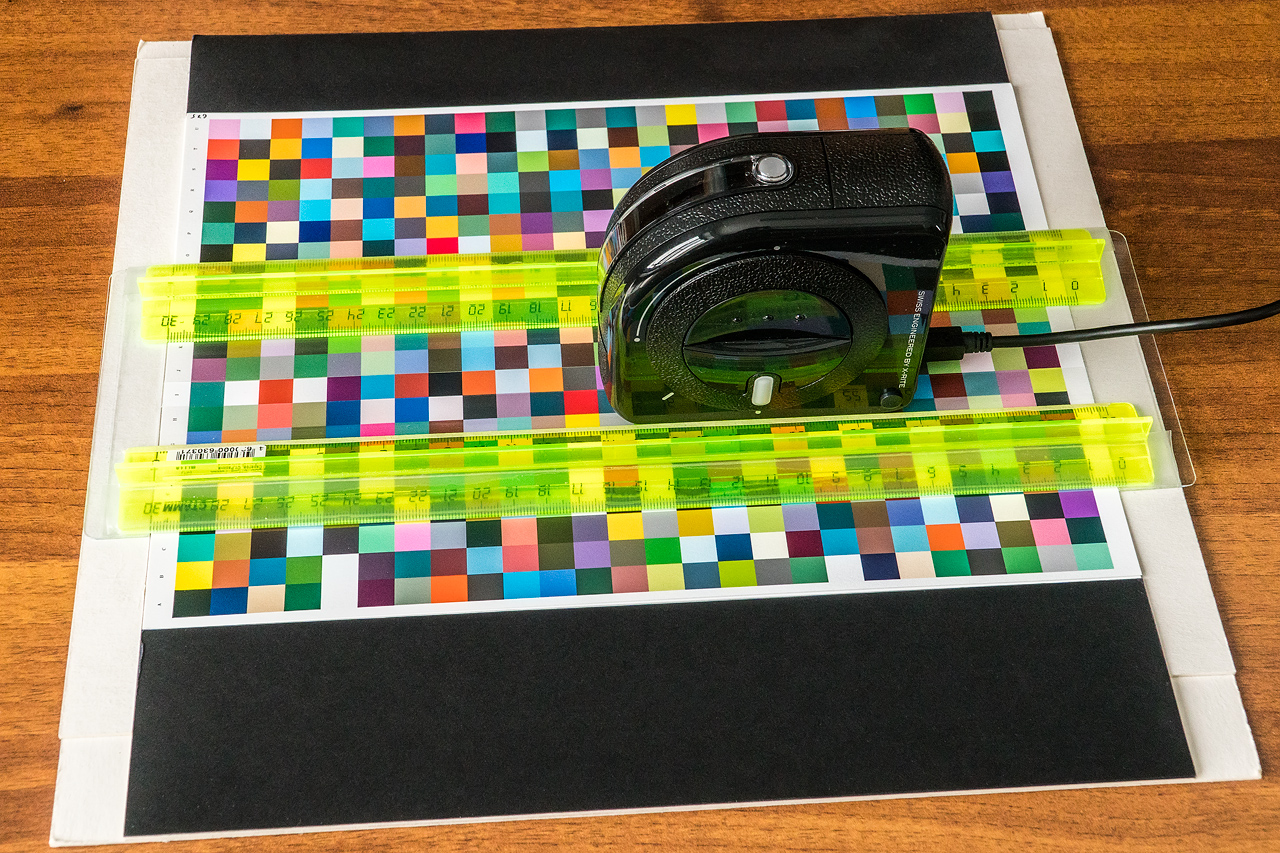
For the convenience of measuring color maps with small patches using a Colormunki Photo spectrophotometer, you can make a simple fixture of cardboard, two rulers and an office file film:
Ambient light measurement mode:  mmmunki -l <measurements file>

Color chart measurement mode:  mmmunki [options] <reference file> <measurements file>
    <reference file> - input reference chart file
    <measurements file> - output measurements file name (without extension)
    options:
      -t - transpose reference data
      -PM5 - save measurements data in ProfileMaker 5 format
      -CB - save measurements data in Epson ColorBase format
      -TI3 - save measurements data in Argyll TI3 format
      -PM5D - save measurements data in ProfileMaker 5 format with density values
      -M<input measurements file1>[,<input measurements file2>[,<input measurements file3> ... ]] - read
          measurements data from files
      -A<N> - automatically advance to next strip after N measurements (default: 1)
      -D<RGB|CMYK> - save measurements data values in RGB|CMYK format (only supported for
          ProfileMaker 5 file format)
      -E<76|94|2000> - set delta E calculation method to CIE76|CIE94|CIEDE2000 (default: CIE2000)
Read reference chart in Argyll CMS format from target.ti2, measure each strip 10 times, save measurements data to result.ti3 file in Argyll CMS format:
mmmunki -TI3 -A10 target.ti2 result
Read reference chart in ProfileMaker 5 format from target_ref.txt, transpose it, measure each strip 10 times, save measurements data to result.txt file in ProfileMaker 5 format:
mmmunki -t -PM5 -A10 target_ref.txt result
Read Epson ColorBase reference chart in ProfileMaker 5 format from SpectroScan.txt, transpose it, measure each strip one time, save measurements data to result.txt file in ColorBase version of ProfileMaker 5 format:
mmmunki -t -CB SpectroScan.txt result
Read reference chart in Argyll CMS format from target.ti2, measure each strip 10 times, save measurements data to result.ti3 file in Argyll CMS format and to result.txt file in ProfileMaker 5 format. This allows you to generate color chart in Argyll CMS, measure it with ColorMunki Photo and create profile in i1Profiler:
mmmunki -TI3 -PM5 -A10 target.ti2 result
If you need to take a break in the middle of measurements, you can save the current results to temporary file, and then load it in the next session:
mmmunki -TI3 -Mtemp.ti3 target.ti2 result
Measure light source spectrum and color temperature and save data to light.txt file.
mmmunki -l light.txt
Now you can analyze it in Spectral calculator. To calculate CRI paste data to text area, open “Additional features and advanced settings” and press “IES-TM-30-15, CRI and CQS” button.
Generate preliminary target of one A4 page size (360DPI):
targen -v -w -d2 -G -N 0 -g64 -s16 -B2 -e2 -f546 -c AdobeRGB1998.icc target_pre
printtarg_m -v -t360 -Q8 -ii1 -a 1.08x1.214 -n -P -p 204x286 -L -m0 -z target_pre
Read reference chart in Argyll CMS format from target_pre.ti2, measure each strip one time, save measurements data to target_pre.ti3 file in Argyll CMS format and to target_pre.txt file in ProfileMaker 5 format:
mmmunki -TI3 -PM5 target_pre.ti2 target_pre
Create preliminary profile:
colprof -v -P -D"profile_pre_argyll" -Zr -qh -bh -r1 -al -S AdobeRGB1998.icc -cmt -dpp target_pre
You can also create preliminary profile in i1Profiler using target_pre.txt file.
Check preliminary profiles against measurements:
profcheck -v -w -k target.ti3 "profile_pre_argyll.icm"
profcheck -v -w -k target_pre.ti3 "profile_pre_i1prof.icm"
Generage target of 6 A4 page size using preliminary profile:
targen -v -w -d2 -G -N 0.3 -g256 -s64 -B4 -e4 -f3276 -c "profile_pre_argyll.icm" target
printtarg_m -v -t360 -Q8 -ii1 -a 1.08x1.214 -n -P -p 204x286 -L -m0 -z target
Read reference chart in Argyll CMS format from target.ti2, measure each strip 10 times, save measurements data to target.ti3 file in Argyll CMS format and to target.txt file in ProfileMaker 5 format:
mmmunki -TI3 -PM5 -A10 target.ti2 target
Create profile:
colprof -v -P -D"profile_argyll" -Zr -qu -bu -r1 -al -S AdobeRGB1998.icc -cmt -dpp target
You can also average measurements of preliminary and main color charts:
average -v -m target.ti3 target_pre.ti3 target_plus.ti3
And create profile using averaged data:
colprof -v -P -D"profile_plus_argyll" -Zr -qu -bu -r1 -al -S AdobeRGB1998.icc -cmt -dpp target_plus
And you can create profile in i1Profiler using target.txt file.
Check profiles against measurements:
profcheck -v -w -k target.ti3 "profile_argyll icm"
profcheck -v -w -k target_pre.ti3 "profile_argyll.icm"
profcheck -v -w -k target.ti3 "profile_plus_argyll.icm"
profcheck -v -w -k target_pre.ti3 "profile_plus_argyll.icm"
profcheck -v -w -k target.ti3 "profile_i1prof.icm"
profcheck -v -w -k target_pre.ti3 "profile_i1prof.icm"
Two methods have been implemented to select the best measurement. Both are based on calculating the difference in color or delta E.
In the first method, the measurement that is closest (by delta E) to the average value of all measurements is selected. First, an average value is calculated for each color component for all measurements. A delta E is then calculated between these means and each of the measurements. A measurement with a minimum delta E value is selected.
Second method selects measurement with minimum total color difference with all other measurements. Delta E can be considered as the distance between two colors in the color space. For each measurement, the sum of distances to all other measurements is calculated. A measurement is selected with a minimum sum of distances.
Currently the second method is used.