标签(空格分隔): CASIA
本周工作主要分为以下几点:
- 通读SqueezeSeg论文并翻译;
- 在服务器上配置虚拟环境,并跑通本例;
- Python入门以及Numpy,SciPy库的学习,深度学习入门从李飞飞CS231n课程开始;
[TOC]
SqueezeSeg文章地址:SqueezeSeg: Convolutional Neural Nets with Recurrent CRF for Real-Time Road-Object Segmentation from 3D LiDAR Point Cloud
在本文中,我们从三维激光雷达点云的角度对道路目标进行了语义分割。我们特别希望检测和分类感兴趣的实例,例如汽车、行人和骑自行车的人。我们制定这个问题作为一个逐点分类的问题,并提出一个端到端的管道称为SqueezeSeg基于卷积神经网络(CNN):CNN需要改变激光雷达点云直接输出作为输入,并逐点地标签地图,然后精制的条件随机场(CRF)实现为复发性层。然后用传统的聚类算法得到实例级的标签。我们的CNN模型是在来自KITTI1数据集的激光雷达点云上训练的,我们的逐点分割标签来自于KITTI的3D边框。为了获得额外的训练数据,我们在广受欢迎的视频游戏《侠盗飞车V》(GTA-V)中构建了一个激光雷达模拟器,以合成大量真实的训练数据。我们的实验表明,SqueezeSeg以惊人的快速和稳定性,每帧(8.7±0.5)ms的高精度运行,高度可取的自主驾驶的应用程序。此外,对综合数据的训练可以提高对真实数据的验证准确性。我们的源代码和合成数据将是开源的。
自动驾驶系统依赖于对环境的准确、实时和鲁棒的感知。自动驾驶汽车需要精确地分类和定位“道路物体”,我们将其定义为与驾驶有关的物体,如汽车、行人、自行车和其他障碍物。不同的自动驾驶解决方案可能有不同的传感器组合,但3D激光雷达扫描仪是最普遍的组件之一。激光雷达扫描仪直接产生环境的距离测量,然后由车辆控制器和计划人员使用。此外,激光雷达扫描仪在几乎所有的光照条件下都是健壮的,无论是白天还是黑夜,有或没有眩光和阴影。因此,基于激光雷达的感知任务引起了广泛的研究关注。
在这项工作中,我们关注道路目标分割使用(Velodyne风格)三维激光雷达点云。给定激光雷达扫描仪的点云输出,任务的目标是隔离感兴趣的对象并预测它们的类别,如图1所示。以前的方法包括或使用以下阶段的部分:删除地面,将剩余的点聚到实例中,从每个集群中提取(手工制作)特性,并根据其特性对每个集群进行分类。这种模式,尽管它的受欢迎程度2,3,4,5,有几个缺点:a)地面分割在上面的管道通常依赖于手工特性或决策规则,一些方法依赖于一个标量阈值6和其他需要更复杂的特性,比如表面法线7或不变的描述符4,所有这些可能无法概括,后者需要大量的预处理。b)多级管道存在复合误差的聚合效应,上面管道中的分类或聚类算法无法利用上下文,最重要的是对象的直接环境。c)很多去除地面的方法都依赖于迭代算法,如RANSAC (random sample consensus) 5, GP-INSAC (Gaussian Process Incremental sample consensus)2,agglomerative clustering2。这些算法组件的运行时间和精度取决于随机初始化的质量,因此可能不稳定。这种不稳定性对于许多嵌入式应用程序(如自动驾驶)来说是不可接受的。我们采取了另一种方法:使用深度学习来提取特征,开发一个单阶段的管道,从而避开步骤迭代算法。
本文提出了一种基于卷积神经网络(CNN)和条件随机场(CRF)的端到端管道。CNNs和CRFs已成功应用于二维图像8、9、10、11的分割任务。为了将CNNs应用于三维激光雷达点云,我们设计了一个CNN,它接受变换后的激光雷达点云,并输出标签点地图,通过CRF模型进一步细化。然后,通过对一个类别中的点应用传统的聚类算法(如DBSCAN)来获得实例级标签。为了将3D点云提供给2D CNN,我们采用球面投影将稀疏的、不规则分布的3D点云转换为密集的2D网格表示。所提出的CNN模型借鉴了squeeze zenet12的思想,经过精心设计,降低了参数大小和计算复杂度,目的是降低内存需求,实现目标嵌入式应用程序的实时推理速度。将CRF模型重构为一个循环神经网络(RNN)模块为11,可以与CNN模型进行端到端训练。我们的模型是在基于KITTI数据集1的激光雷达点云上训练的,点分割标签是从KITTI的3D边框转换而来的。为了获得更多的训练数据,我们利用Grand Theft Auto V (GTA-V)作为模拟器来检索激光雷达点云和点级标签。 实验表明,这种方法精度高、速度快、稳定性好,适用于自动驾驶。我们还发现,用人工的、噪声注入的模拟数据替代我们的数据集进一步提高了对真实世界数据的验证准确性。
A. 3维激光雷达点元的语义分割 以前的工作在激光雷达分割中看到了广泛的粒度范围,处理从特定组件到整个管道的任何事情。7提出了基于网格的地面和基于局部表面凹凸性的目标分割。2总结了几种基于迭代算法的诸如RANSAC (random sample consensus)和GP-INSAC (gaussian process incremental sample consensus)的地面去除方法。最近的工作也集中在算法效率上。5提出了有效的地面分割和聚类算法,而13绕过地面分割直接提取前景对象。4将重点扩展到整个管道,包括分割、聚类和分类。提出了将点斑块重新划分为不同类别的背景和前景对象,然后使用EMST-RANSAC5进一步集群实例。
B. 3D点云CNN CNN方法考虑的是二维或三维的激光雷达点云。处理二维数据时考虑的是用激光雷达点云投影自顶向下14或从许多其他视图15投影的原始图像。其他工作考虑的是三维数据本身,将空间离散为体素和工程特征,如视差、平均和饱和度16。无论数据准备如何,深度学习方法都考虑利用二维卷积17或三维卷积18神经网络的端对端模型。
C. 图像的语义分割 CNNs和CRFs都被用于图像的语义分割任务。8提议将经过分类训练的CNN模型转换为完全卷积网络来预测像素级标签。9提出了一种用于图像分割的CRF公式,并用均值-场迭代算法近似求解。CNNs和CRFs合并在10中,CNN用于生成初始概率图,CRF用于细化和恢复细节。在11中,平均场迭代被重新表述为一个递归神经网络(RNN)模块。
D. 模拟数据采集 获取注释,特别是点或像素级的注释对于计算机视觉任务来说通常是非常困难的。因此,合成数据集引起了越来越多的关注。在自动驾驶社区中,视频游戏《侠盗猎车手》被用来检索数据,用于目标检测和分割19、20。
A. 点云转换
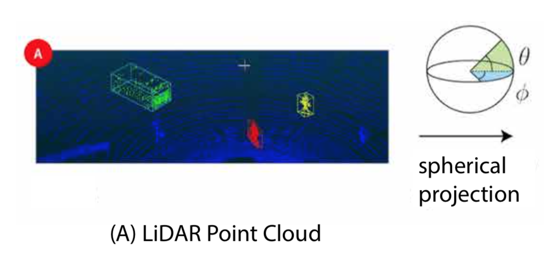
传统CNN模型操作图像,可以由3-dimentional张量的大小 H × W × 3表示。前二维编码空间位置,其中H和W分别为图像高度和宽度。最后一个维度编码特性,最常见的是RGB值。然而,三维激光雷达点云通常表示为一组笛卡尔坐标(x, y, z),也可以包含额外的特征,如强度或RGB值。与图像像素的分布不同,激光雷达点云的分布通常是稀疏而不规则的。因此,纯粹地将3D空间离散为立体像素会导致过多的空voxels。处理这样的稀疏数据是低效的,浪费计算。 为了获得更紧凑的表示,我们将激光雷达点云投射到一个球体上,以实现密集的、基于网格的表示:
这种特征使我们能够避免手工制作的功能,从而提高我们的表现形式所概括的几率。
B. 网络结构
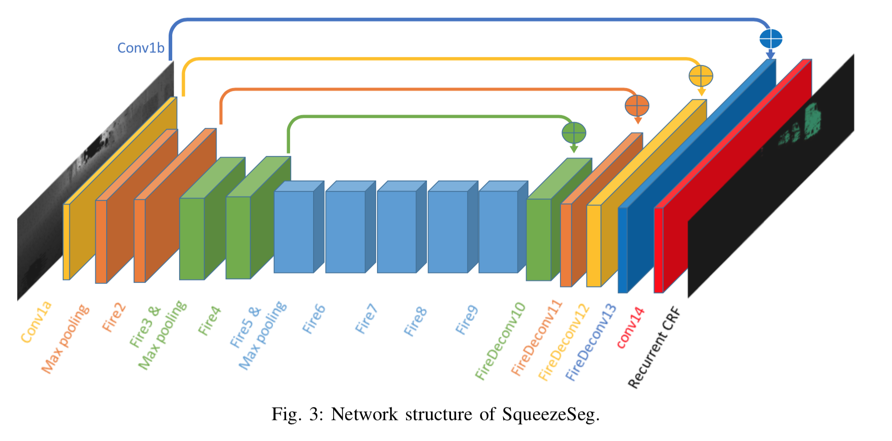
我们的卷积神经网络结构如图3所示。
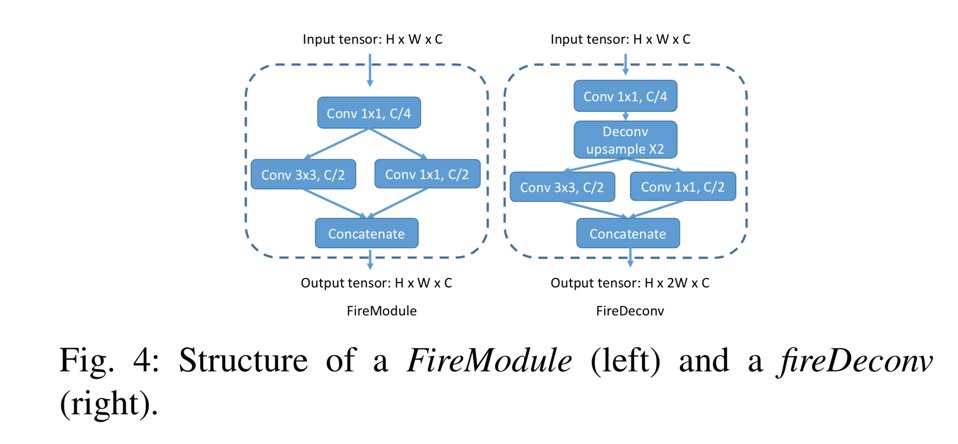
SqueezeSeg源自SqueezeNet12,这是一种轻量级CNN,可以实现AlexNet21级精度,参数减少50倍。 SqueezeSeg的输入是64 × 512 × 5张量,如上一节所述。我们从SqueezeNet移植层(conv1a到fire9)以进行特征提取。SqueezeNet使用max-pooling来对宽度和高度尺寸的中间特征图进行下采样,但由于我们的输入张量高度远小于宽度,我们只对宽度进行下采样。fire9的输出是一个下采样的特征映射,它对点云的语义进行编码。 为了获得每个点的全分辨率标签预测,我们使用反卷积模块(更确切地说,“转置卷积”)来对宽度维度中的特征映射进行上采样。 我们使用跳过连接将上采样特征映射添加到相同大小的低级特征映射,如图3所示。输出概率图由具有softmax激活的卷积层(conv14)生成。概率图由循环CRF层进一步细化,这将在下一节中讨论。 为了减少模型参数和计算的数量,我们用fireModules 12和fireDeconvs替换了卷积和反卷积层。两个模块的体系结构如图4所示。
在fireModule中,大小为H×W×C的输入张量首先被馈入1x1卷积,以将信道大小减小到C/4。接下来,使用3x3卷积来融合空间信息。与并行1x1卷积一起,它们恢复C的通道大小。输入1x1卷积称为挤压层,并行1x1和3x3卷积合称为扩展层。给定匹配的输入和输出大小,3x3卷积层需要 要将宽度尺寸上采样2,常规的1x4反卷积层必须包含
C. 条件随机场
通过图像分割,CNN模型预测的标签图往往具有模糊的边界。 这是由于在下采样操作(例如最大池)中丢失了低级细节。 SqueezeSeg中也观察到类似的现象。 准确的逐点标签预测不仅需要了解对象和场景的高级语义,还需要了解低级细节。 后者对于标签分配的一致性至关重要。 例如,如果云中的两个点彼此相邻并且具有相似的强度测量值,则它们可能属于同一对象并因此具有相同的标签。 在10之后,我们使用条件随机场(CRF)来细化由CNN生成的标签图。 对于给定的点云和标签预测c,其中$c_i$表示第i个点的预测标签,CRF模型使用能量函数:
一元多项式 $ u_i(c_i) = -logP(c_i)$ 考虑来自CNN分类器的预测概率 $ P(c_i)$。二元多项式定义了用于将不同标签分配给一对相似点的“惩罚”,并且被定义为
其中 $ \mu(c_i,c_j) = 1 , c_i \neq c_j 且 c_i,c_j \neq 0
在我们的工作中,我们使用了两个高斯核:
第一项取决于两个点的角位置 $ \mathcal{P}(\widetilde{\theta},\widetilde{\phi}) $ 和笛卡尔坐标 $ X(x,y,z)$。第二项仅取决于角度位置。 $ \sigma_\alpha $ ,$ \sigma_\beta $ 和 $ \sigma_\gamma $ 是根据经验选择的三个超参数。还可以包括强度和RGB值等额外功能。
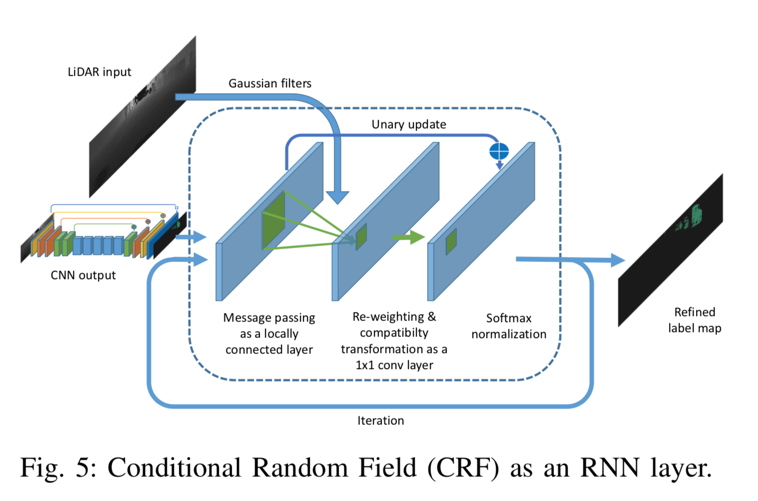
最小化上述CRF能量函数产生精细的标签分配。方程(2)的精确最小化是难以处理的,但9提出了一种平均场迭代算法来近似有效地求解它。 11将平均场迭代重新表述为递归神经网络(RNN)。我们将读者引用9和11来详细推导平均场迭代算法及其作为RNN的表述。这里,我们仅提供作为RNN模块的平均场迭代的实现的简要描述,如图5所示。
CNN模型的输出作为初始概率图被馈送到CRF模块中。接下来,我们基于输入特征计算高斯核,如等式(3)。
最小化上述CRF能量函数产生精细的标签分配。方程(2)的精确最小化是难以处理的,但9提出了一种平均场迭代算法来近似有效地求解它。 11将平均场迭代重新表述为递归神经网络(RNN)。我们将读者引用9和11来详细推导平均场迭代算法及其作为RNN的表述。这里,我们仅提供作为RNN模块的平均场迭代的实现的简要描述,如图5所示.CNN模型的输出作为初始概率图被馈送到CRF模块中。接下来,我们基于输入特征计算高斯核作为等式(3)。随着两点之间的距离(在3D笛卡尔空间和2D角空间中)增加,上述高斯核的值下降得非常快。因此,对于每个点,我们将内核大小限制为输入张量上的3×5的小区域。接下来,我们使用上面的高斯核过滤初始概率图。这个步骤在11中也被称为消息传递,因为它基本上聚合了相邻点的概率。该步骤可以实现为具有上面的Guassian内核作为参数的本地连接层。接下来,我们对聚合概率进行重新加权并使用“兼容性转换”来确定它改变每个点的分布的程度。此步骤可以实现为1x1卷积,其参数在训练期间学习。接下来,我们通过将初始概率添加到1x1卷积的输出来更新初始概率,并使用softmax对其进行标准化。模块的输出是精确的概率图,可以通过迭代地应用该过程来进一步细化。在我们的实验中,我们使用3次迭代来获得准确的标签贴图。这种经常性的CRF模块与CNN模型一起可以端到端地一起训练。通过单阶段管道,我们可以回避多阶段工作流中存在的传播错误的线索,并相应地利用上下文信息。
D. 数据集
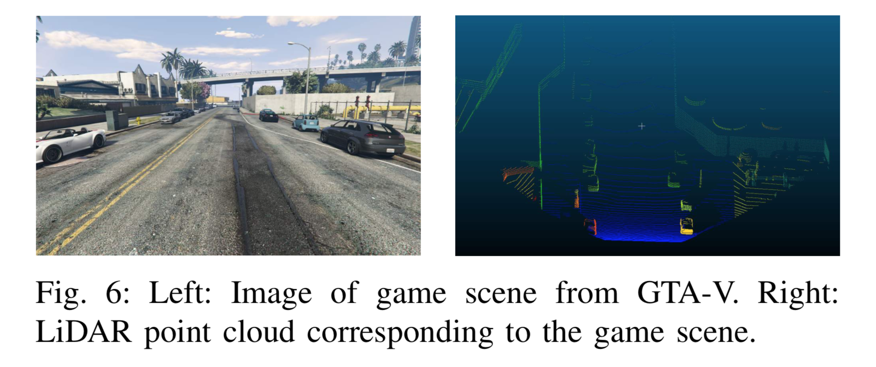
我们的初始数据来自KITTI原始数据集,该数据集提供按顺序组织的图像,LiDAR扫描和3D边界框。 逐点注释从3D边界框转换。 对象的3D边界框内的所有点都被视为目标对象的一部分。 然后,我们为每个点分配相应的标签。这种转换的一个例子可以在图2(A,B)中找到。使用这种方法,我们收集了10,848个带有逐点标签的图像。 为了获得更多的训练样本(点云和逐点标签),我们在GTA-V中构建了一个LiDAR模拟器。模拟器的框架基于DeepGTAV1,它使用Script Hook V2作为插件。 我们在游戏中的汽车上安装了一个虚拟的LiDAR扫描仪,然后将其设置为自动驾驶。系统收集LiDAR点云和游戏屏幕。在我们的设置中,虚拟激光雷达和游戏摄像机位于相同的位置,这提供了两个优点:首先,我们可以轻松地对收集的数据进行健全性检查,因为点和图像需要保持一致。其次,点和图像可以用于其他研究项目,例如传感器融合等。
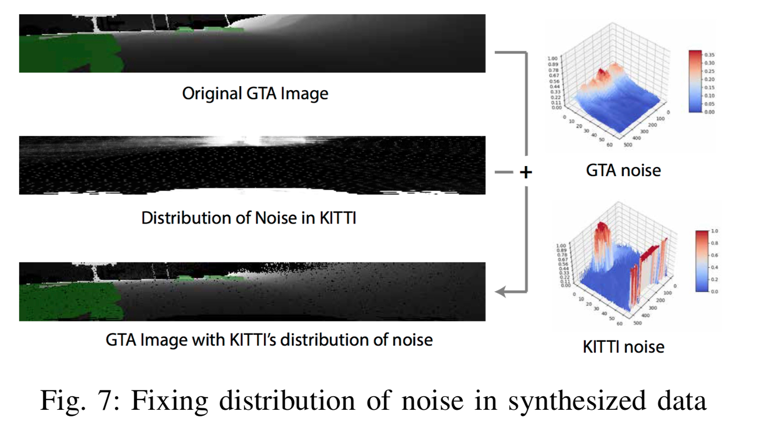
我们使用光线投射来模拟LiDAR发射的每个激光射线。每个激光射线的方向基于LiDAR设置的几个参数:垂直视场(FOV),垂直分辨率,俯仰角和点云扫描中的射线索引。通过一系列API,可以获得与每条射线相关的以下数据:a)射线命中的第一个点的坐标,b)命中对象的类,c)命中对象的实例ID(即对于实例分割等有用),d)对象命中的中心和边界框。 使用这个模拟器,我们构建了一个包含8,585个样本的合成数据集,大约是我们训练集大小的两倍。 为了使数据更加真实,我们进一步分析了KITTI点云噪声的分布(图7)。
我们在每个径向坐标处获取噪声的经验频率并归一化以获得有效的概率分布:1)设$P_i$是前面在III-A部分中描述3D张量,表示第i个KITTI点云的球面投影的“像素值”的格式。对于n个KITTI点云中的每一个,考虑($\widetilde{\theta}$,$\widetilde{\phi}$)坐标处的像素是否包含“噪声”。为简单起见,我们认为“噪声”是缺失数据,其中所有像素通道都为零。 然后($\widetilde{\theta}$,$\widetilde{\phi}$)坐标处的噪声经验频率为:
然后我们可以使用KITTI数据中的噪声分布来增加合成数据。 对于合成数据集中的任何点云,在点云的每个($\widetilde{\theta}$,$\widetilde{\phi}$)坐标处,我们通过将所有特征值设置为0,以概率$ \epsilon(\widetilde{\theta},\widetilde{\phi}$)随机地添加噪声。 值得注意的是,GTA-V为行人使用了非常简单的物理模型,通常会将人员减少到汽缸。此外,GTA-V不为自行车手编写单独的类别,而是在所有账户上单独标记人员和车辆。出于这些原因,我们决定在使用我们的综合数据集进行训练时,专注于KITTI评估的“汽车”类。
未完待续
# 下载anaconda
$ wget https://repo.continuum.io/archive/Anaconda3-5.0.1-Linux-x86_64.sh
$ bash Anaconda3-5.0.1-Linux-x86_64.sh
#添加环境变量
$ echo 'export PATH="~/anaconda3/bin:$PATH"' >> ~/.bashrc
$ git clone https://github.com/BichenWuUCB/SqueezeSeg.git
# 设置虚拟环境
$ virtualenv env
# 激活虚拟环境
$ source env/bin/activate
- 使用PyCharm同步远程代码
下载专业版Pycharm,https://account.jetbrains.com/licenses/assets,需要到网站获取professional license。
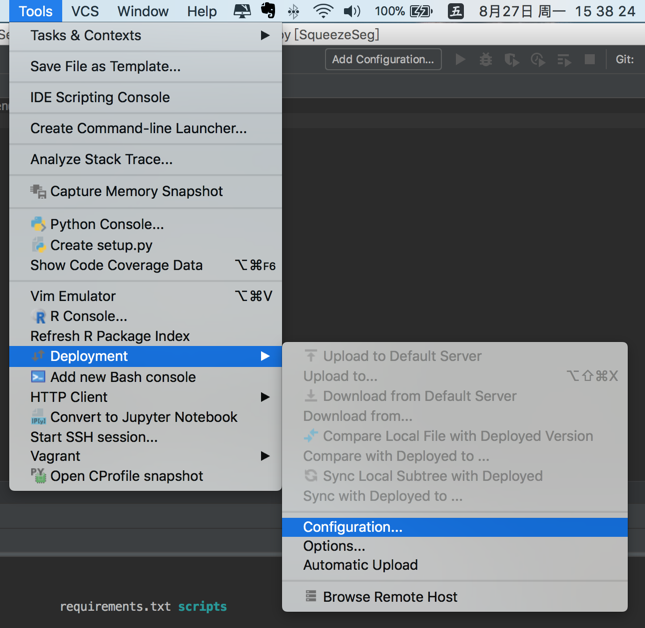
打开本地项目,如图点击设置,
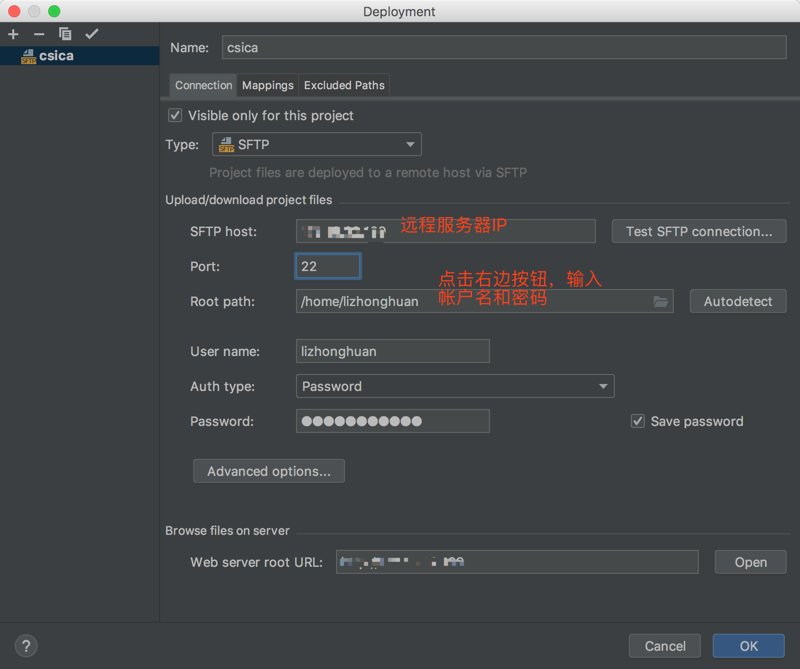
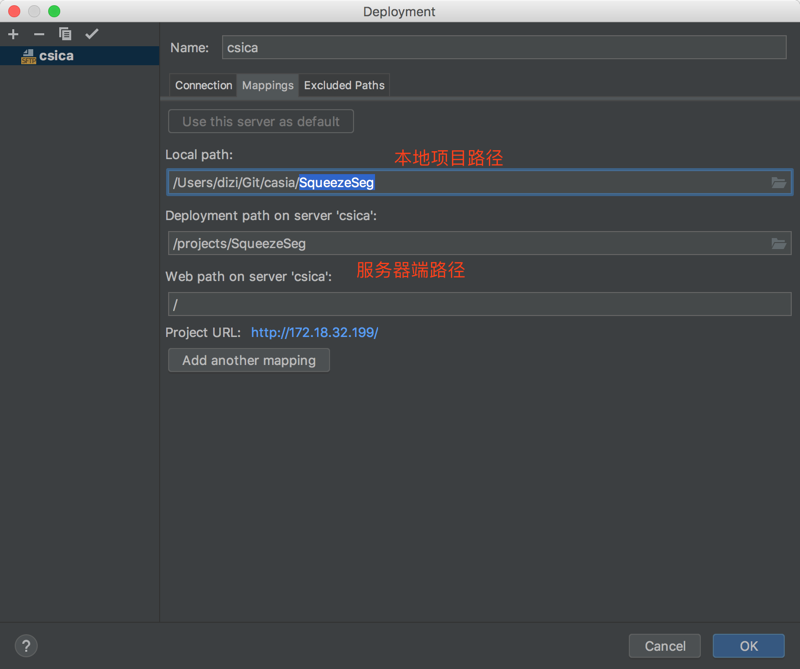
点击add server,添加一个服务器,Name自定义,Type选SFTP;
配置映射关系:
点击项目,Tools -> Deployment -> Upload to ...,即可上传本地代码;
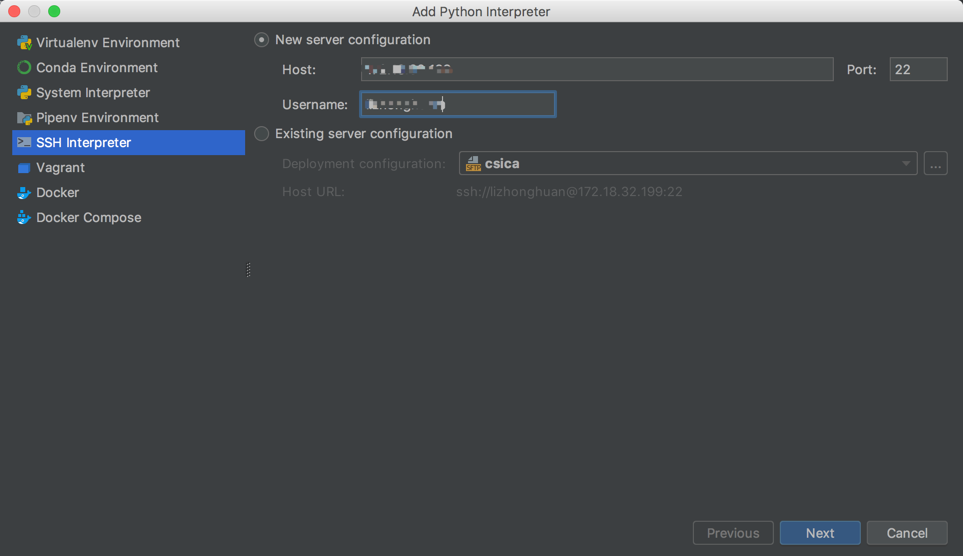
点击添加python解释器:
- 使用sublime text同步远程代码
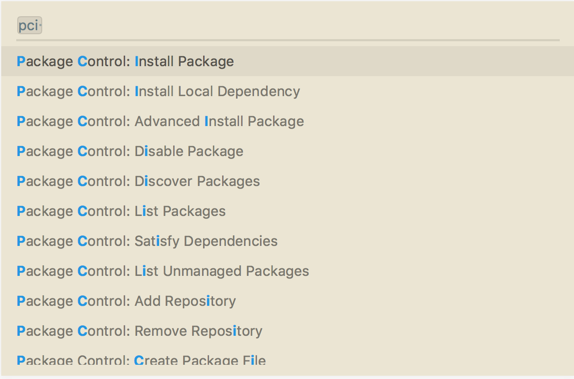
安装sftp,shift + command + p,输入sftp,
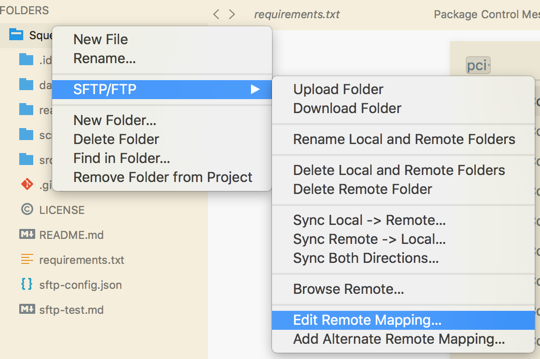
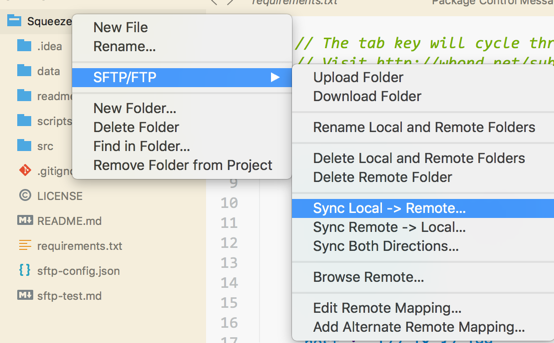
打开项目文件夹,在文件夹上右击,如图:
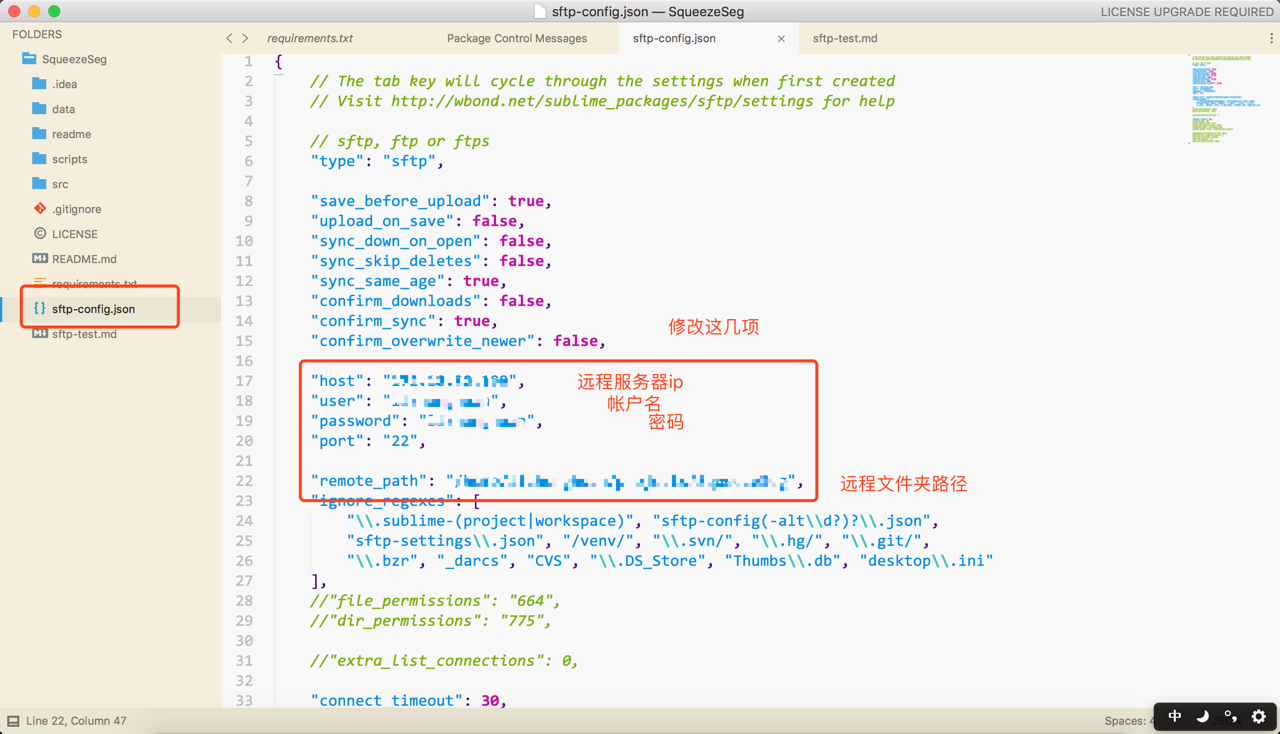
点击之后会在目录下生成一个json文件,修改json文件内容:
之后修改本地文件,在文件夹右键,里面的选项即可同步。
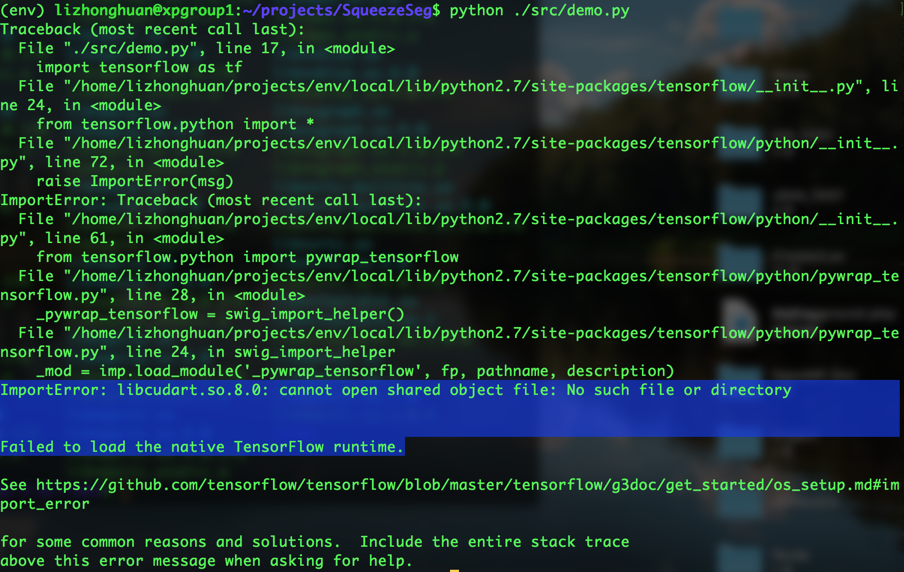
Traceback (most recent call last):
  File "./src/demo.py", line 17, in <module>
    import tensorflow as tf
  File "/home/lizhonghuan/projects/env/local/lib/python2.7/site-packages/tensorflow/__init__.py", line 24, in <module>
    from tensorflow.python import *
  File "/home/lizhonghuan/projects/env/local/lib/python2.7/site-packages/tensorflow/python/__init__.py", line 72, in <module>
    raise ImportError(msg)
ImportError: Traceback (most recent call last):
  File "/home/lizhonghuan/projects/env/local/lib/python2.7/site-packages/tensorflow/python/__init__.py", line 61, in <module>
    from tensorflow.python import pywrap_tensorflow
  File "/home/lizhonghuan/projects/env/local/lib/python2.7/site-packages/tensorflow/python/pywrap_tensorflow.py", line 28, in <module>
    _pywrap_tensorflow = swig_import_helper()
  File "/home/lizhonghuan/projects/env/local/lib/python2.7/site-packages/tensorflow/python/pywrap_tensorflow.py", line 24, in swig_import_helper
    _mod = imp.load_module('_pywrap_tensorflow', fp, pathname, description)
ImportError: libcudart.so.8.0: cannot open shared object file: No such file or directory


Failed to load the native TensorFlow runtime.

See https://github.com/tensorflow/tensorflow/blob/master/tensorflow/g3doc/get_started/os_setup.md#import_error

for some common reasons and solutions.  Include the entire stack trace
运行提示缺少libcudart.so.8.0,怀疑是因为没有安装cuda8.0,使用以下方法解决,是没有安装tensorflow的gpu版本
$ pip install tensorflow-gpu
config包下明明有module,不明的原因?
ModuleNotFoundError: No module named x
ImportError: libcudart.so.8.0: cannot open shared object file: No such file or directory

Failed to load the native TensorFlow runtime.

See https://github.com/tensorflow/tensorflow/blob/master/tensorflow/g3doc/get_started/os_setup.md#import_error
# 解决办法
# 将tensorflow-gpu升级
$ pip install --upgrade tensorflow-gpu
总结:是由于tensorflow-gpu版本不匹配导致,服务器上安装的是支持最新的库的cuda。
Python入门参考斯坦福CS231n入门总结,见参考链接[知乎]3,以下是部分笔记:
数字
x = 3
print type(x) # Prints "<type 'int'>"
print x       # Prints "3"
print x + 1   # Addition; prints "4"
print x - 1   # Subtraction; prints "2"
print x * 2   # Multiplication; prints "6"
print x ** 2  # Exponentiation; prints "9"
x += 1
print x  # Prints "4"
x *= 2
print x  # Prints "8"
y = 2.5
print type(y) # Prints "<type 'float'>"
print y, y + 1, y * 2, y ** 2 # Prints "2.5 3.5 5.0 6.25"
布尔
t = True
f = False
print type(t) # Prints "<type 'bool'>"
print t and f # Logical AND; prints "False"
print t or f  # Logical OR; prints "True"
print not t   # Logical NOT; prints "False"
print t != f  # Logical XOR; prints "True"
字符串
hello = 'hello'   # String literals can use single quotes
world = "world"   # or double quotes; it does not matter.
print hello       # Prints "hello"
print len(hello)  # String length; prints "5"
hw = hello + ' ' + world  # String concatenation
print hw  # prints "hello world"
hw12 = '%s %s %d' % (hello, world, 12)  # sprintf style string formatting
print hw12  # prints "hello world 12"
字符串对象方法
s = "hello"
# 首字母大写
s.capitalize()
# 转换为大写
s.upper()
# 字符右对齐,参数为总位数
s.rjust(8)
# 居中对齐
s.center()
# 字符替换
s.replace('l','ell')
# 去除空格
'   world! '.strip()
列表
xs = [3, 1, 2]   # Create a list
print xs, xs[2]  # Prints "[3, 1, 2] 2"
print xs[-1]     # Negative indices count from the end of the list; prints "2"
xs[2] = 'foo'    # Lists can contain elements of different types
print xs         # Prints "[3, 1, 'foo']"
xs.append('bar') # Add a new element to the end of the list
print xs         # Prints
x = xs.pop()     # Remove and return the last element of the list
print x, xs      # Prints "bar [3, 1, 'foo']"
切片
nums = range(5)    # range is a built-in function that creates a list of integers
print nums         # Prints "[0, 1, 2, 3, 4]"
print nums[2:4]    # Get a slice from index 2 to 4 (exclusive); prints "[2, 3]"
print nums[2:]     # Get a slice from index 2 to the end; prints "[2, 3, 4]"
print nums[:2]     # Get a slice from the start to index 2 (exclusive); prints "[0, 1]"
print nums[:]      # Get a slice of the whole list; prints ["0, 1, 2, 3, 4]"
print nums[:-1]    # Slice indices can be negative; prints ["0, 1, 2, 3]"
nums[2:4] = [8, 9] # Assign a new sublist to a slice
print nums         # Prints "[0, 1, 8, 9, 4]"
循环
# 基本用法
animals = ['cat', 'dog', 'monkey']
for animal in animals:
    print animal
# Prints "cat", "dog", "monkey", each on its own line.
# 索引和指针
animals = ['cat', 'dog', 'monkey']
for idx, animal in enumerate(animals):
    print '#%d: %s' % (idx + 1, animal)
# Prints "#1: cat", "#2: dog", "#3: monkey", each on its own line
列表推导
# 以下两种方式等价
# 1
nums = [0, 1, 2, 3, 4]
squares = []
for x in nums:
    squares.append(x ** 2)
# 2
nums = [0, 1, 2, 3, 4]
squares = [x ** 2 for x in nums]
# 包含条件的列表推导
nums = [0, 1, 2, 3, 4]
even_squares = [x ** 2 for x in nums if x % 2 == 0]
print even_squares  # Prints "[0, 4, 16]"
字典
d = {'cat': 'cute', 'dog': 'furry'}  # Create a new dictionary with some data
print d['cat']       # Get an entry from a dictionary; prints "cute"
print 'cat' in d     # Check if a dictionary has a given key; prints "True"
d['fish'] = 'wet'    # Set an entry in a dictionary
print d['fish']      # Prints "wet"
# print d['monkey']  # KeyError: 'monkey' not a key of d
print d.get('monkey', 'N/A')  # Get an element with a default; prints "N/A"
print d.get('fish', 'N/A')    # Get an element with a default; prints "wet"
del d['fish']        # Remove an element from a dictionary
print d.get('fish', 'N/A') # "fish" is no longer a key; prints "N/A"
循环字典
d = {'person': 2, 'cat': 4, 'spider': 8}
for animal in d:
    legs = d[animal]
    print 'A %s has %d legs' % (animal, legs)
# Prints "A person has 2 legs", "A spider has 8 legs", "A cat has 4 legs"

d = {'person': 2, 'cat': 4, 'spider': 8}
for animal, legs in d.iteritems():
    print 'A %s has %d legs' % (animal, legs)
# Prints "A person has 2 legs", "A spider has 8 legs", "A cat has 4 legs"
元组
d = {(x, x + 1): x for x in range(10)}  # Create a dictionary with tuple keys
print d
t = (5, 6)       # Create a tuple
print type(t)    # Prints "<type 'tuple'>"
print d[t]       # Prints "5"
print d[(1, 2)]  # Prints "1"
函数(略) 类
class Greeter(object):

    # Constructor
    def __init__(self, name):
        self.name = name  # Create an instance variable

    # Instance method
    def greet(self, loud=False):
        if loud:
            print 'HELLO, %s!' % self.name.upper()
        else:
            print 'Hello, %s' % self.name
Numpy文档 数组Arrays
import numpy as np

a = np.array([1, 2, 3])  # Create a rank 1 array
print type(a)            # Prints "<type 'numpy.ndarray'>"
print a.shape            # Prints "(3,)"
print a[0], a[1], a[2]   # Prints "1 2 3"
a[0] = 5                 # Change an element of the array
print a                  # Prints "[5, 2, 3]"

b = np.array([[1,2,3],[4,5,6]])   # Create a rank 2 array
print b                           # 显示一下矩阵b
print b.shape                     # Prints "(2, 3)"
print b[0, 0], b[0, 1], b[1, 0]   # Prints "1 2 4"
import numpy as np

a = np.zeros((2,2))  # Create an array of all zeros
print a              # Prints "[[ 0.  0.]
                     #          [ 0.  0.]]"

b = np.ones((1,2))   # Create an array of all ones
print b              # Prints "[[ 1.  1.]]"

c = np.full((2,2), 7) # Create a constant array
print c               # Prints "[[ 7.  7.]
                      #          [ 7.  7.]]"

d = np.eye(2)        # Create a 2x2 identity matrix
print d              # Prints "[[ 1.  0.]
                     #          [ 0.  1.]]"

e = np.random.random((2,2)) # Create an array filled with random values
print e                     # Might print "[[ 0.91940167  0.08143941]
                            #               [ 0.68744134  0.87236687]]"
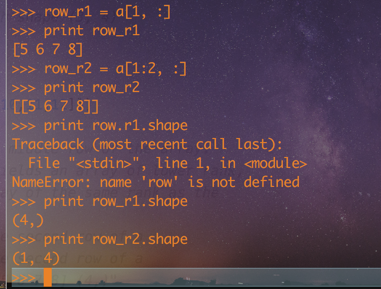
row_r1 = a[1, :]
row_r2 = a[1:2, :]
a = np.array([[1,2], [3, 4], [5, 6]])
print a[[0, 1, 2], [0, 1, 0]]
# 等价于
print np.array([a[0, 0], a[1, 1], a[2, 0]])

print a[[0, 0], [1, 1]]
# 等价于
print np.array([a[0, 1], a[0, 1]])
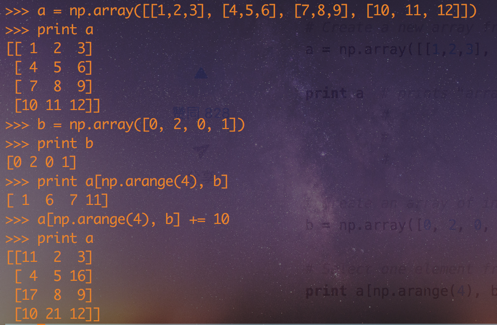
a = np.array([[1,2,3], [4,5,6], [7,8,9], [10, 11, 12]])
b = np.array([0, 2, 0, 1])
print a[np.arange(4), b]
a[np.arange(4), b] += 10
print a
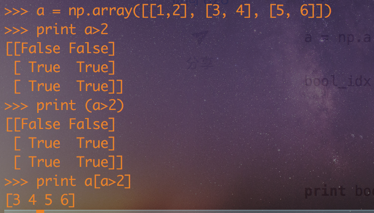
a = np.array([[1,2], [3, 4], [5, 6]])
print a>2
print a[a>2]
数据类型
import numpy as np

x = np.array([1, 2])  # Let numpy choose the datatype
print x.dtype         # Prints "int64"

x = np.array([1.0, 2.0])  # Let numpy choose the datatype
print x.dtype             # Prints "float64"

x = np.array([1, 2], dtype=np.int64)  # Force a particular datatype
print x.dtype                         # Prints "int64"
数组计算
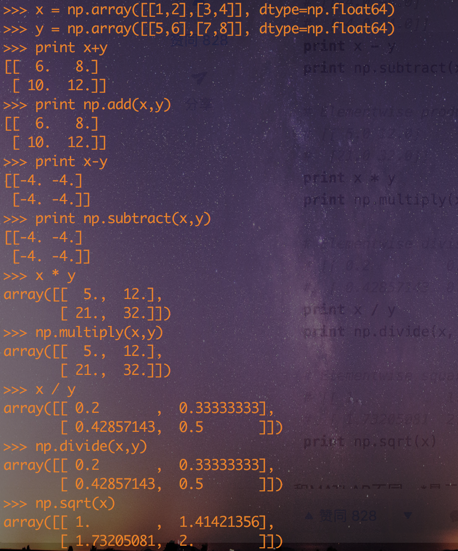
x = np.array([[1,2],[3,4]], dtype=np.float64)
y = np.array([[5,6],[7,8]], dtype=np.float64)
# 加
print x + y
print np.add(x, y)
# 减
print x - y
print np.subtract(x, y)
# 乘
print x * y
print np.multiply(x, y)
# 除
print x / y
print np.divide(x, y)
# 开方
print np.sqrt(x)
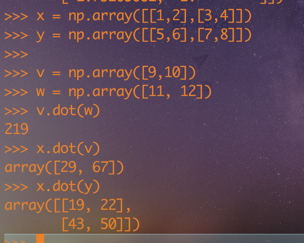
# 矩阵乘法
x = np.array([[1,2],[3,4]])
y = np.array([[5,6],[7,8]])

v = np.array([9,10])
w = np.array([11, 12])

print v.dot(w)
print np.dot(v, w)

print x.dot(v)
print np.dot(x, v)

print x.dot(y)
print np.dot(x, y)
# sum运算
x = np.array([[1,2],[3,4]])

print np.sum(x)  # Compute sum of all elements; prints "10"
print np.sum(x, axis=0)  # Compute sum of each column; prints "[4 6]"
print np.sum(x, axis=1)  # Compute sum of each row; prints "[3 7]"
# 转秩
x = np.array([[1,2], [3,4]])
print x    # Prints "[[1 2]
           #          [3 4]]"
print x.T  # Prints "[[1 3]
           #          [2 4]]"

# Note that taking the transpose of a rank 1 array does nothing:
v = np.array([1,2,3])
print v    # Prints "[1 2 3]"
print v.T  # Prints "[1 2 3]"
广播是一种强有力的机制,它让Numpy可以让不同大小的矩阵在一起进行数学计算。我们常常会有一个小的矩阵和一个大的矩阵,然后我们会需要用小的矩阵对大的矩阵做一些计算。
import numpy as np

# We will add the vector v to each row of the matrix x,
# storing the result in the matrix y
x = np.array([[1,2,3], [4,5,6], [7,8,9], [10, 11, 12]])
v = np.array([1, 0, 1])
y = np.empty_like(x)   # Create an empty matrix with the same shape as x

# Add the vector v to each row of the matrix x with an explicit loop
for i in range(4):
    y[i, :] = x[i, :] + v

# Now y is the following
# [[ 2  2  4]
#  [ 5  5  7]
#  [ 8  8 10]
#  [11 11 13]]
print y
这样是行得通的,但是当x矩阵非常大,利用循环来计算就会变得很慢很慢。我们可以换一种思路:
import numpy as np

# We will add the vector v to each row of the matrix x,
# storing the result in the matrix y
x = np.array([[1,2,3], [4,5,6], [7,8,9], [10, 11, 12]])
v = np.array([1, 0, 1])
vv = np.tile(v, (4, 1))  # Stack 4 copies of v on top of each other
print vv                 # Prints "[[1 0 1]
                         #          [1 0 1]
                         #          [1 0 1]
                         #          [1 0 1]]"
y = x + vv  # Add x and vv elementwise
print y  # Prints "[[ 2  2  4
         #          [ 5  5  7]
         #          [ 8  8 10]
         #          [11 11 13]]"
Numpy广播机制可以让我们不用创建vv,就能直接运算:
import numpy as np

# We will add the vector v to each row of the matrix x,
# storing the result in the matrix y
x = np.array([[1,2,3], [4,5,6], [7,8,9], [10, 11, 12]])
v = np.array([1, 0, 1])
y = x + v  # Add v to each row of x using broadcasting
print y  # Prints "[[ 2  2  4]
         #          [ 5  5  7]
         #          [ 8  8 10]
         #          [11 11 13]]"
对两个数组的广播机制要遵守规则: 规则文档
from scipy.misc import imread, imsave, imresize

# 图片从硬盘读到数组中
img = imread('assets/cat.jpg')
print img.dtype, img.shape  # Prints "uint8 (400, 248, 3)"
img_tinted = img * [1, 0.95, 0.9]

# 我们可以通过用不同的标量常数缩放每个颜色通道来对图像着色。
# 图像具有形状(400,248,3);我们将它乘以形状(1,)的数组[1,0.95,9.9];
# numpy广播意味着它保持红色通道不变,并将绿色和蓝色通道分别乘以0.95和0.9。
img_tinted = img * [1, 0.95, 0.9]

# Resize the tinted image to be 300 by 300 pixels.
img_tinted = imresize(img_tinted, (300, 300))

# Write the tinted image back to disk
imsave('assets/cat_tinted.jpg', img_tinted)
# 函数说明: range(start, stop[, step]) -> range object,根据start与stop指定的范围以及step设定的步长,生成一个序列。
np.range

# 函数说明:arange([start,] stop[, step,], dtype=None)根据start与stop指定的范围以及step设定的步长,生成一个 ndarray。 dtype : dtype
np.arange
import numpy as np
import matplotlib.pyplot as plt

# Compute the x and y coordinates for points on a sine curve
x = np.arange(0, 3 * np.pi, 0.1)
y = np.sin(x)

# Plot the points using matplotlib
plt.plot(x, y)
plt.show()  # You must call plt.show() to make graphics appear.
x = np.arange(0, 3 * np.pi, 0.1)
y_sin = np.sin(x)
y_cos = np.cos(x)

# Plot the points using matplotlib
plt.plot(x, y_sin)
plt.plot(x, y_cos)
plt.xlabel('x axis label')
plt.ylabel('y axis label')
plt.title('Sine and Cosine')
plt.legend(['Sine', 'Cosine'])
plt.show()
# Set up a subplot grid that has height 2 and width 1,
# and set the first such subplot as active.
plt.subplot(2, 1, 1)

# Make the first plot
plt.plot(x, y_sin)
plt.title('Sine')

# Set the second subplot as active, and make the second plot.
plt.subplot(2, 1, 2)
plt.plot(x, y_cos)
plt.title('Cosine')

# Show the figure.
plt.show()
img = imread('assets/cat.jpg')
img_tinted = img * [1, 0.95, 0.9]

# 显示图片
plt.imshow(img)
-
论文相关 今天将最后一部分翻译完成,具体论文并未作深入分析;
-
环境任务 本论文环境配置完成,已将demo.py跑通,并按照要求生成了结果,如图:
具体并没有看懂生成的数据,需要下周结合代码分析;
- 基础学习
已掌握Python的基本语法,能看懂并写出基本的Python程序,numpy库还需要熟练; 李飞飞深度学习持续补充中。。。
- 英语比较薄弱,翻译较为吃力,应加快看论文的速度;
- 论文中有好多的专有名词性解释需要补充学习,暂时未遇到图形学相关内容,如遇到应尽快补充;
- 对论文中涉及到的深度学习算法不了解,应该尽快熟悉并了解;
- 阅读论文VoxelNet: End-to-End Learning for Point Cloud Based 3D Object Detection并配置论文环境;
- 阅读上一篇论文的代码,分析重要的算法部分,关键部分给出注释;利用网站给出的数据训练模型,对深度学习过程有一个整体的宏观感觉;
- 继续学习李飞飞深度学习内容,完成新的章节并完成练习;
