-
Notifications
You must be signed in to change notification settings - Fork 27.7k
New issue
Have a question about this project? Sign up for a free GitHub account to open an issue and contact its maintainers and the community.
By clicking “Sign up for GitHub”, you agree to our terms of service and privacy statement. We’ll occasionally send you account related emails.
Already on GitHub? Sign in to your account
Script debugging no longer seem to work in Chrome DevTools and VS Code #4571
Comments
|
Besides Babel 7 nothing significant changed 🤔 |
|
Added needs investigation label, reminder to everyone who 👎 and 😕 that you can contribute to Next.js instead by investigating issues don't have an immediately clear issue. There's over 250 open issues currently. |
|
I got it somewhat1 working by changing the The
Just some observations I made. I'm not familiar enough with next, webpack or vscode debugging internals to say were a change needs to be made. 1 |
This comment has been minimized.
This comment has been minimized.
This comment has been minimized.
This comment has been minimized.
|
@eps1lon Thanks, that worked for me too! But I've tried more options and it seems to me that the best option (performance-wise) that still works is actually Could you please confirm that, so I can get a PR going? For completion's sake - my results with both now's Next.js example as well as my own TS-based Next.js app were: ✔️ cheap-module-eval-source-map ❌ cheap-module-source-map |
|
hi 👋 @s-h-a-d-o-w . Looks like |
|
What launch configurations are you guys using? I've got server side debugging working in both VS Code/Chrome. Client side I've not yet tried. |
|
@chrisd08 are you able to debug the |
|
@bengry Yes, although for some reason it seems to report unverified breakpoints in VS Code. Solution was to create a debug script in package.json such as:
And use following compound launch profile. Note that the cwd option should point to wherever the nextjs pages directory is. In the monorepo structure I was testing with I had to append "/packages/web". There was one project I couldn't get debugging working with, and after a painful process of trial and error discovered that having allowJS set to true in tsconfig.json breaks debugging, why that is I have no idea. Edit: I've fixed the source mapping issue in VS Code, updated launch config. The cwd options pointing to the right location is critical. (Breakpoints in pages/components show as unverified until the they are built for the first time.) |
|
Has there been any progress on this? |
|
I've been unsuccessful being able to debug a Next.js app in VS-Code. I've tried many times and cannot get it to work. It'd be nice if there was an example added to show debugging a Next.js app in general and a custom server Next.js app as well. Edit: |
|
I would love to know how to get this working |
|
Here's my setup, working with typescript. I think it's easier to get working without TS. The key is the webpack config in the next.config.js. Hope this helps. launch.json: tsconfig.json: nodemon.json: next.config.js: |
|
I've managed to get both server side and client side debugging working here: For those having issues could you test against that repo and report back? |
|
Hey there, I just got it working in latest Next.js versions too, I created a documentation page for Next.js website, let me know what you think: #10807 |
I was having trouble setting debug breakpoints using vscode in next 9.3 server api endpoints, and this worked for me. Clicking the vscode debug sidebar to set a breakpoint using the UI does not work, but I can still manually add |
|
All seems to work out of the box with 9.4. I couldn't even debug on chrome with 9.3. VScode lunch config: {
"version": "0.2.0",
"configurations": [
{
"type": "chrome",
"request": "launch",
"name": "Launch Chrome against localhost",
"url": "http://localhost:6500/cucumber",
"webRoot": "${workspaceFolder}"
}
]
}
|
|
For me still not working unfortunately :( |
|
@JoseFMP could you clone and try the steps in this repo? https://github.com/jasonwilliams/nextjs9-typescript-server-vscode-example |
|
This issue has been automatically locked due to no recent activity. If you are running into a similar issue, please create a new issue with the steps to reproduce. Thank you. |
Hi Kenneth from VS Code here. We are getting reports that Script debugging no longer works in VS Code, after our users have upgraded to
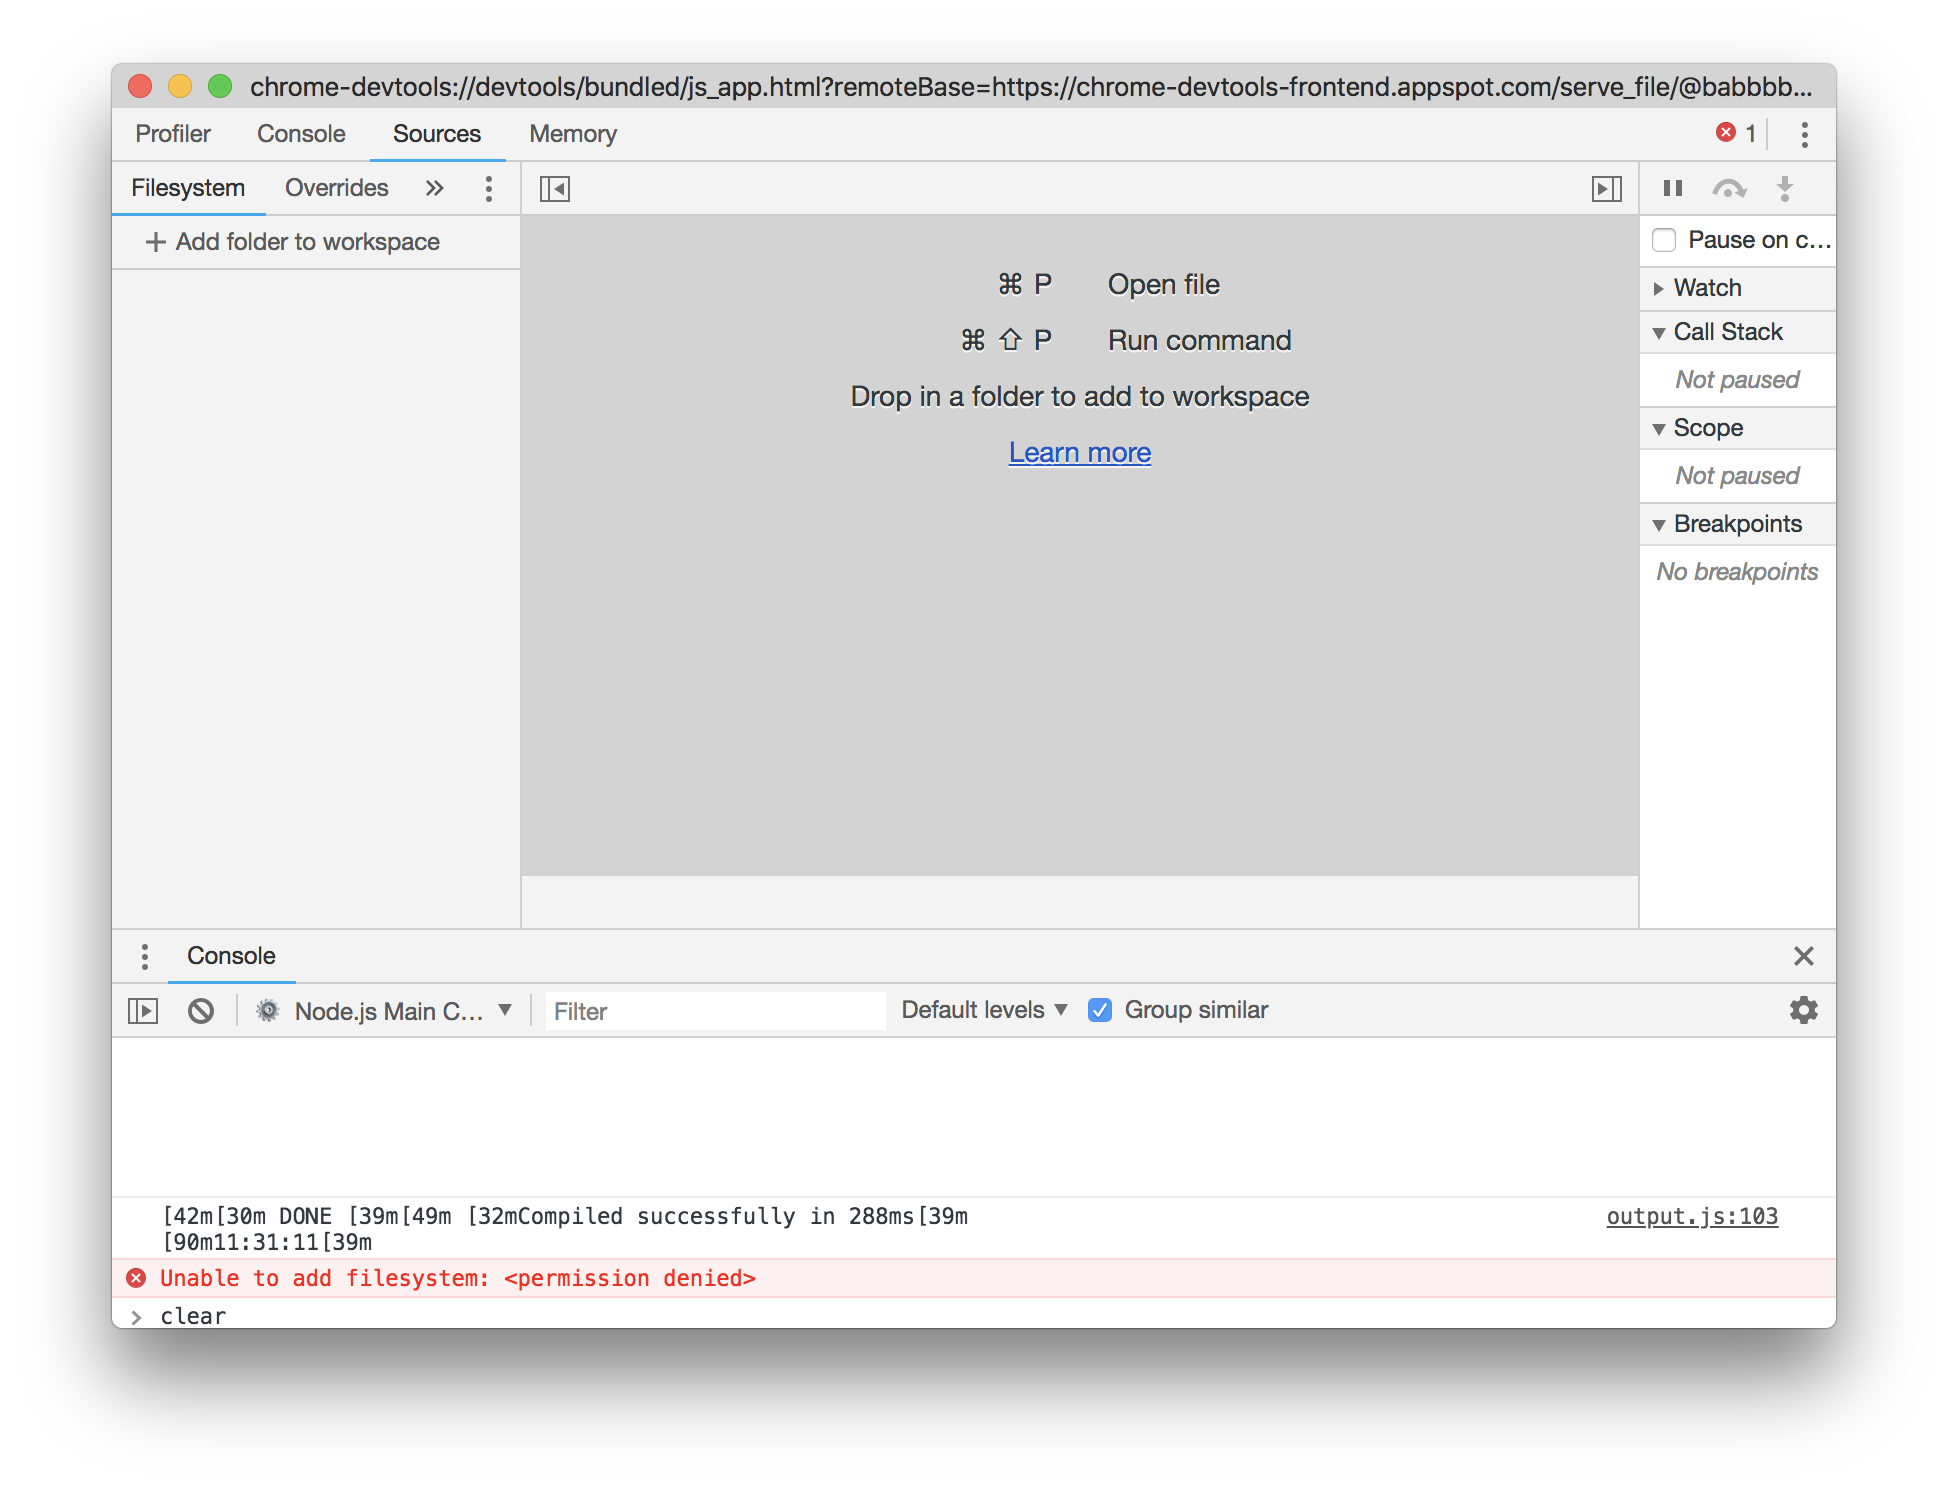
Next.js 6.0+. See microsoft/vscode-recipes#103I just validated this myself with both VS Code and Chrome DevTools, and the issue seems to be that app components no longer are getting exposed by the debugger, which means that Chrome DevTools doesn't list the files under Sources, and VS Code can't map the loaded scripts to the files open inside VS Code.
I'm wondering if internals of next.js have changed so you load app scripts in a different way in relation to the main Node process which debuggers attaches to after next have been started with
next --inspect?Demo app:
https://github.com/now-examples/nextgram
Chrome DevTools:

VS Code
Loaded script observed by our debugger:
The text was updated successfully, but these errors were encountered: