https://www.citibikenyc.com/system-data
Stored as CSV in CustomerData file and Citi Bike Data file
Tableau
Jupyter Notebook (python)
Cleaned Column names and merged all years in Citi Bike Data
Cleaned Column names and merged 2018-2020 in CustomerData
Areas of interest did not contain missing values.
https://public.tableau.com/profile/daniel.bradley1709#!/vizhome/citi_bike_public/Story?publish=yes
-There are ~3x more male-user trips than female .
-There is a high usage of citi bikes in Summer-time across all age groups.
-Highest usage for ages range between 25-35 for 2019.
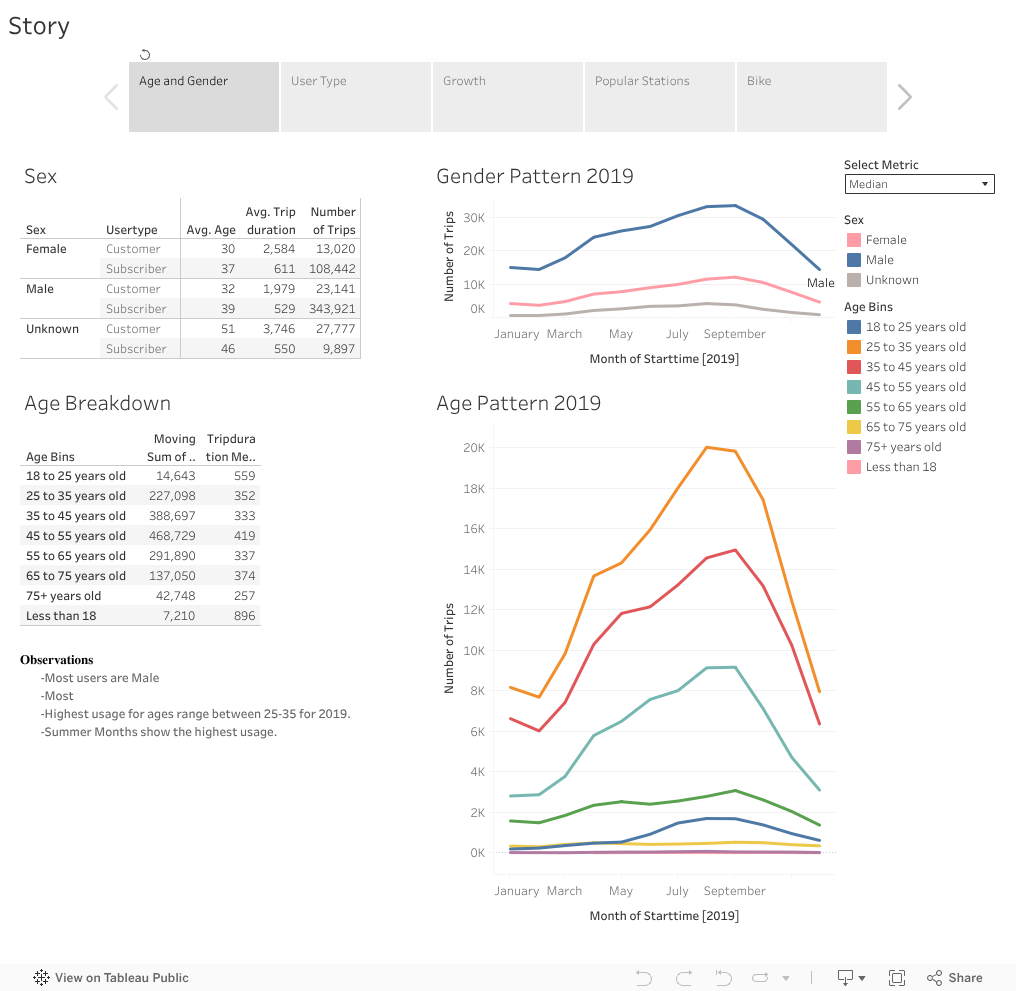
-Users are primarily subscribers.
-Customers are spending more time per ride.
-The median trip for customers has been growing closer to the 30 min limit(before overage fees), with a current median of ~25min.
-3:00AM and 2:00PM are the median usage peaks suggesting primary use is commuting.

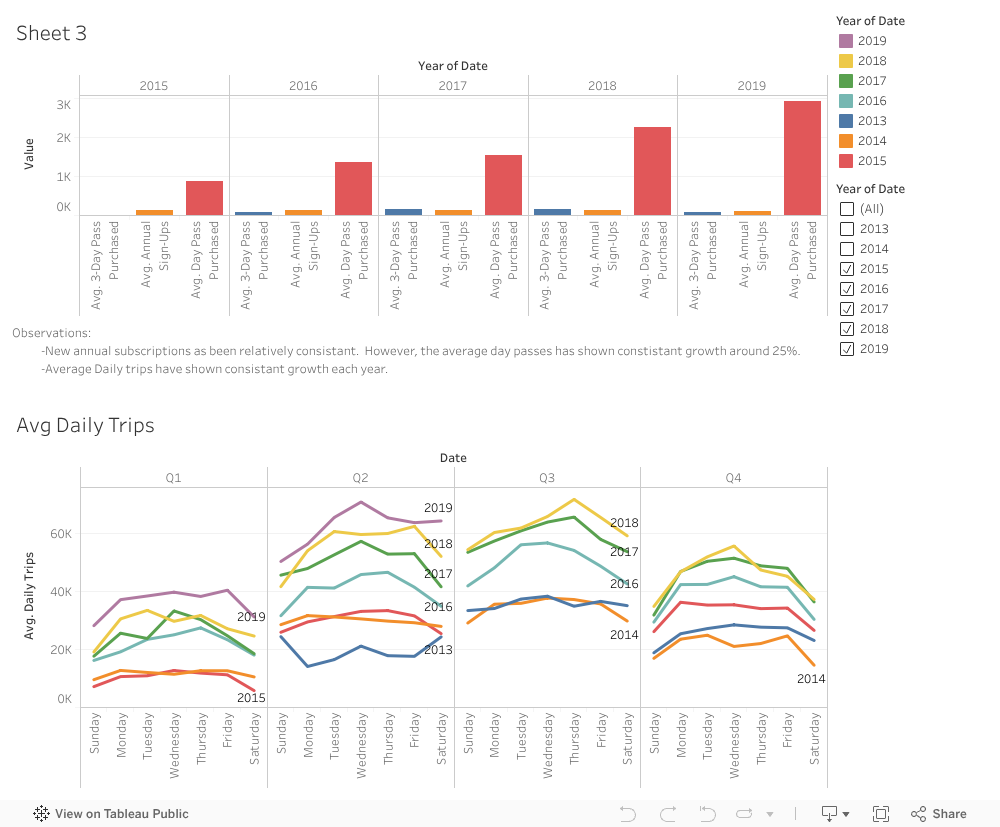
-New annual subscriptions as been relatively consistant.  However, the average day passes has shown constistant growth around 25%.
-Average Daily trips have shown consistant growth each year.
-Top 10 starting AND stopping stations are all located in New Jersey.
