-
Notifications
You must be signed in to change notification settings - Fork 10
Functionality
- Why using PhyloProfile?
- Dynamic visualization
- Dynamic analysis functions
- Cross interaction between profile plots and analysis functions
- Optional data representation
- Interoperable output
- More
PhyloProfile can dynamically visualize and explore multi-layered phylogenetic profiles.
Two addtional layers of information can be integrated into a presence/absence phylogenetic profile could be any comparable value between seed protein and its ortholog, e.g. sequence similarity, domain architecture similarity, semantic similartiy of Gene Ontology terms, taxonomic distances, 3D structure similarity, etc.
Users can:
- dynamically change the resolution of the analysis from invidual species to phyla or entire kingdoms by collapsing the input taxa into higher systematic rank (*).
- dynamically filter data by applying different thresholds to the integrated information.
- dynamically modify the apperance of profile with diverse plot configuration options.
(*) PhyloProfile is able to represent co-orthologs (in-paralogs), if the working taxonomic rank is the deepest one (e.g. strain or species) that can be found in the input taxa.
Users can visualize the complete profile (Main profile) or only a subset of genes and taxa for a detailed study (Customized profile).
Besides, PhyloProfile's interface will be automatically varied according to user's input files, such as the names of two additional information layers or list of input taxa.
Implemented with interactive ability, PhyloProfile provides several useful functions for analyzing phylogenetic profiles.
- Profile clustering: cluster genes according to the distance of their phylogenetic profiles in order to bring similar profiles together. The similarity of profiles can indicate the novel functional relation between proteins.

- Gene age estimation: estimate the evolutionary age of genes using an LCA algorithm, i.e. the last common ancestor of the two most distantly related species in the ortholog group serves as the minimal gene age of that group.

-
Core gene identification: find genes that are shared in all selected taxa. The core gene set can be used for e.g. phylogenetic tree reconstruction.
-
Distribution analysis: from the distribution of the values of two integrated information layers and the percentage taxa summarize at the chosen taxonomic rank, users can decide a reasonable filtering threshold.

- Group comparison: compare the distributions of two integrated variables between two taxon groups: an user defined in-group and an out-group (taxa that are not part of the in-group).

The phylogenetic profile plots (Main profile & Customized profile) and analysis functions can interact with each other.
The filtering thresholds applied on the Main profile will affect the result of the Gene age estimation, Core gene identification or Distribution analysis. The result from Profile clustering can be applied to the Main profile accordingly.
A set of similar genes chosen from Profile clustering, all genes that have the same evolutionary age selected from Gene age estimation, or core genes of an interested list of taxa can be directly submitted to Customized profile for a detailed analysis.

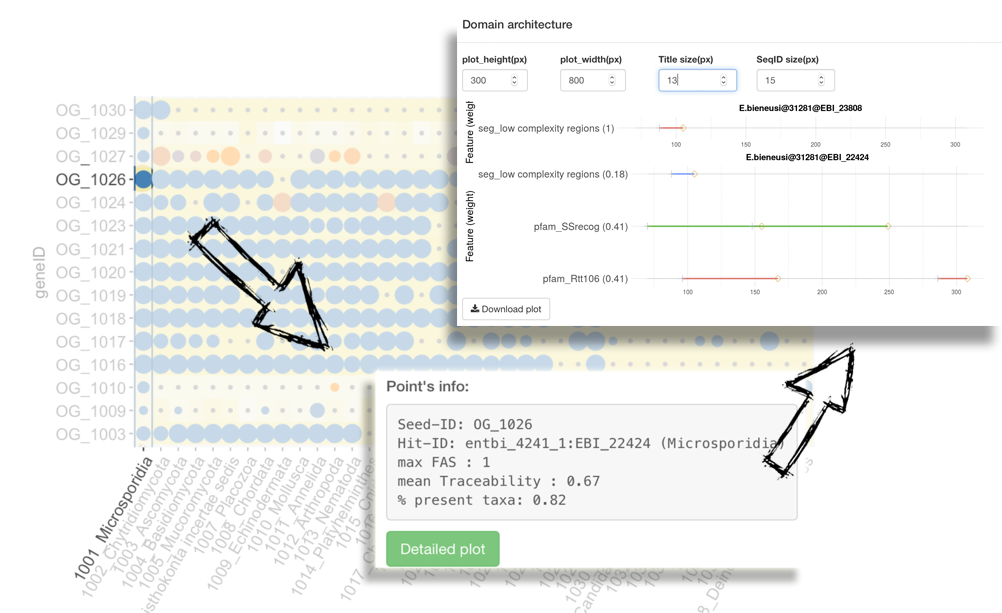
In adddition to displaying the basic information of a protein including the protein ID, the taxon it belongs to and the values of two integrated information layers, PhyloProfile is able to represent its FASTA sequence as well as a plot (Domain architecture plot) showing the domain architecture comparison between two proteins (seed and ortholog) (*).

(*) if only the architecture of the selected protein is present, the Domain architecture plot will show only the domain annotation for that protein.
All plots generated in PhyloProfile can be exported as PDF files.
Filtered data of Main profile and Customized profile can be downloaded as a list and multi-fasta file for further downstream inspection, e.g. phylogenomic tree reconstruction or metabolic pathway analysis.
Read the walkthrough slides to explore the full functionality of PhyloProfile.