MsImpute is a R package for imputation of peptide intensity in proteomics experiments. It additionally contains tools for MAR/MNAR diagnosis and assessment of distortions to the probability distribution of the data post imputation.
The missing values are imputed by low-rank approximation of the underlying data matrix if they are MAR (method = "v2"), by Barycenter approach if missingness is MNAR ("v2-mnar"), or by Peptide Identity Propagation (PIP). While "v2" approach is more appropriate for imputation of data acquired by DIA, "v2-mnar" is designed for imputation of DDA, TMT and time-series datasets. However, the true dynamic range can not be reliably recovered by imputation, particularly in datasets with small sample sizes (for example, 3-5 replicates per experimental condition).
Our PIP approach infers the missing intensity values for an identification based on similarity of LC-MS features of peptide-like signals detected in MS1 (e.g. by a feature detector) and the identified peptides. We currently support MaxQuant outputs, including DDA-PASEF datasets. We strongly recommend the PIP approach for imputation of time-series, or datasets which suffer from large (> 50%) missing values per run. Our PIP enhances data completeness, while reporting weights that measure the confidence in propagation. These can be used as observation-level weights in limma linear models to improve differential abundance testing, by incorporating the uncertainty in intensity values that are inferred by PIP into the model. We have given a demo of PIP approach on a published DDA dataset below.
Please note R version 4.1.1 or later is required
Install from Github:
install.packages("devtools") # devtools is required to download and install the package
devtools::install_github("DavisLaboratory/msImpute")
Install from Bioconductor:
if(!requireNamespace("BiocManager", quietly = TRUE))
    install.packages("BiocManager")
BiocManager::install("msImpute")
library(msImpute)

# xna is a numeric matrix with NAs (for MAR/MNAR diagnosis only)
# "group" defines experimental condition (e.g. control, treatment etc).

# select peptides missing in at least one experimental group
selectFeatures(xna, method="ebm", group=group)


# select peptides that can be informative for
# exploring missing value patterns at high abundance
selectFeatures(xna, method="hvp", n_features=500)


# impute MAR data by low-rank models (v2 is enhanced version of v1 implementation)
xcomplete <- msImpute(xna, method="v2")


# impute MNAR data by low-rank models (adaptation of low-rank models for MNAR data)
xcomplete <- msImpute(xna, method="v2-mnar", group=group)
Example workflows can be found under figures/ in the reproducibility repository associated with the manuscript.
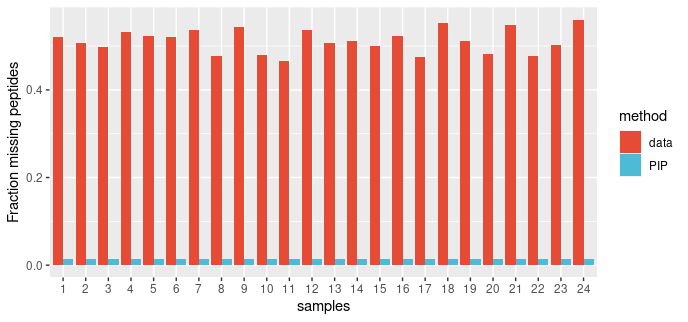
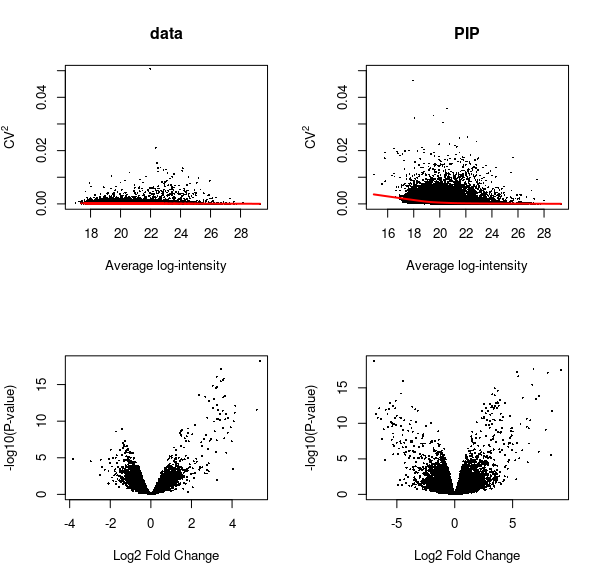
We applied the PIP framework to a DDA dataset.The dataset consists of eight experimental condition, each with three replicates (total of 24 runs). Twelve non-human proteins were spiked at known concentrations into constant HEK-293 background. We examined proportion of missing peptides per run before and after PIP. The volcano plots represent data for comparing group 8 vs group 1.
PIP reduces the proportion of missing values substantially, almost to zero.
Figure: The proportion of missing peptides per sample in PASS00589 DDA dataset before and after PIP.
PIP recovers the low abundance peptides and re-constructs the true dynamic range
Low-abundance peptides not quantified by MaxQuant are recovered, and differential abundance results are improved. Note down regulated peptides that are not present in the volcano plot of DE test on MQ-reported data (bottom left), that are recovered by PIP (bottom right volcano plot) for the same experimental contrast.
The PIP workflow involves the following two function calls:
dda_pip <- mspip("/path/to/combined/txt", k=3, thresh = 0.0, tims_ms = FALSE, skip_weights = FALSE)
y_pip <- evidenceToMatrix(dda_pip, return_EList = TRUE)
Test for differential abundance in limma:
y_pip <- normalizeBetweenArrays(y_pip, method = "quantile")
design <- model.matrix(~ group)
fit <- lmFit(y_pip, design)
fit <- eBayes(fit)
summary(decideTests(fit))
limma automatically recognizes the EListRaw object created by evidenceToMatrix, applies log2 transformation to intensity
values, and passes the PIP confidence scores as observation-level weights to lmFit.
Need more help to start? Please see documentation. We have also collected a number of case studies here
Questions? Please consider openning an issue.
@article{hediyeh2023msimpute,
  title={MsImpute: Estimation of missing peptide intensity data in label-free quantitative mass spectrometry},
  author={Hediyeh-Zadeh, Soroor and Webb, Andrew I and Davis, Melissa J},
  journal={Molecular \& Cellular Proteomics},
  pages={100558},
  year={2023},
  publisher={Elsevier}
}

