这个项目是学习clickhouse时写的, 因为没啥好的测试数据, 以前尝试过改binlog2sql代码, 实时解析binlog将原始sql和回滚sql写到MySQL, 但尝试做一些分析查询的时候就完蛋了.
所以当时也是想看看ClickHouse性能到底咋样. 目前我这边单表已经存了80亿数据了(而且数据只占110G空间), 有物化视图加持查询速度还是杠杠的.
systemd配置文件
#cat broker_dml_monitor.service
[Unit]
Description=Broker DML Monitor

[Service]
Type=simple
EnvironmentFile=/etc/sysconfig/broker_dml_monitor
ExecStart=/root/.pyenv/versions/canal_kafka_consume/bin/python /home/devops/mon_mysql_dml.py $OPTIONS
Restart=always

[Install]
WantedBy=multi-user.target


#cat /etc/sysconfig/broker_dml_monitor
OPTIONS="--bootstrap-servers=x1:9092,x2:9092,x3:9092 --topic=dba_prod_broker --ch_db=mysql_monitor --ch_table=broker_binlog_local --sync=5000 --k_user=admin --from-stored --partition=0 --consumer-group=dba_prod_broker"
查看运行状态
[root@bj3-mysql-dba-prod-03 18:07:39 /etc/systemd/system]
#systemctl status broker_dml_monitor -l
● broker_dml_monitor.service - Broker DML Monitor
   Loaded: loaded (/etc/systemd/system/broker_dml_monitor.service; disabled; vendor preset: disabled)
   Active: active (running) since Thu 2020-08-27 14:53:16 CST; 3h 15min ago
 Main PID: 8826 (python)
    Tasks: 8
   Memory: 43.8M
   CGroup: /system.slice/broker_dml_monitor.service
           └─8826 /root/.pyenv/versions/canal_kafka_consume/bin/python /home/devops/mon_mysql_dml.py --bootstrap-servers=x1:9092,x2:9092,x3:9092 --topic=dba_prod_broker --ch_db=mysql_monitor --ch_table=broker_binlog_local --sync=5000 --k_user=admin --from-stored --partition=0 --consumer-group=dba_prod_broker

Aug 27 17:45:07 bj3-mysql-dba-prod-03 python[8826]: 5007 insert
Aug 27 17:45:07 bj3-mysql-dba-prod-03 python[8826]: 5004 insert
Aug 27 17:45:07 bj3-mysql-dba-prod-03 python[8826]: 5019 insert
Aug 27 17:45:07 bj3-mysql-dba-prod-03 python[8826]: 5018 insert
Aug 27 17:45:07 bj3-mysql-dba-prod-03 python[8826]: 5016 insert
Aug 27 17:45:07 bj3-mysql-dba-prod-03 python[8826]: 5008 insert
Aug 27 17:45:07 bj3-mysql-dba-prod-03 python[8826]: 5000 insert
Aug 27 17:45:07 bj3-mysql-dba-prod-03 python[8826]: 5021 insert
Aug 27 17:45:07 bj3-mysql-dba-prod-03 python[8826]: 5002 insert
Aug 27 17:45:07 bj3-mysql-dba-prod-03 python[8826]: 5017 insert
可以看到实际运行消耗内存不大
目前5分钟一个时间窗口进行计算, 结果写入clickhouse, 使用systemd管理
systemd配置
#cat compute_trans.service
[Unit]
Description=DB portrayal compute transaction informations

[Service]
Type=simple
WorkingDirectory=/home/devops/
ExecStart=/root/.pyenv/versions/clichouse/bin/python /home/devops/compute_transaction_info.py
Restart=always

[Install]
WantedBy=multi-user.target
查看运行状态
#systemctl status compute_trans -l
● compute_trans.service - DB portrayal compute transaction informations
   Loaded: loaded (/etc/systemd/system/compute_trans.service; disabled; vendor preset: disabled)
   Active: active (running) since Tue 2020-08-25 19:59:23 CST; 1 day 22h ago
 Main PID: 24273 (python)
    Tasks: 1
   Memory: 34.2M
   CGroup: /system.slice/compute_trans.service
           └─24273 /root/.pyenv/versions/clichouse/bin/python /home/devops/compute_transaction_info.py

Aug 25 19:59:23 bj2-clickhouse-all-prod-04 systemd[1]: Started DB portrayal compute transaction informations.canal消费后直接写入
-- 本地表
CREATE TABLE mysql_monitor.broker_binlog_local
(
    `schema` String COMMENT '数据库名',
    `table` String COMMENT '表名',
    `event_type` String COMMENT '语句类型',
    `is_ddl` UInt8 COMMENT 'DDL 1 else 0',
    `binlog_file` String COMMENT 'binlog文件名',
    `binlog_pos` String COMMENT 'binlog pos',
    `characterset` String COMMENT '字符集',
    `execute_time` DateTime COMMENT '执行的时间',
    `gtid` String COMMENT 'gtid',
    `single_statement_affected_rows` UInt32 COMMENT '此语句影响行数',
    `single_statement_size` String DEFAULT '0' COMMENT '此语句size,单位bytes',
    `ctime` DateTime DEFAULT now() COMMENT '写入clickhouse时间'
)
ENGINE = ReplicatedMergeTree('/clickhouse/mysql_monitor/tables/{layer}-{shard}/broker_binlog', '{replica}')
PARTITION BY toDate(execute_time)
ORDER BY (execute_time, gtid, table, schema)
TTL execute_time + toIntervalMonth(30)
SETTINGS index_granularity = 8192


-- 分布式表
CREATE TABLE mysql_monitor.broker_binlog
(
    `schema` String COMMENT '数据库名',
    `table` String COMMENT '表名',
    `event_type` String COMMENT '语句类型',
    `is_ddl` UInt8 COMMENT 'DDL 1 else 0',
    `binlog_file` String COMMENT 'binlog文件名',
    `binlog_pos` String COMMENT 'binlog pos',
    `characterset` String COMMENT '字符集',
    `execute_time` DateTime COMMENT '执行的时间',
    `gtid` String COMMENT 'gtid',
    `single_statement_affected_rows` UInt32 COMMENT '此语句影响行数',
    `single_statement_size` String DEFAULT '0' COMMENT '此语句size,单位bytes',
    `ctime` DateTime DEFAULT now() COMMENT '写入clickhouse时间'
)
ENGINE = Distributed('ch_cluster_all', 'mysql_monitor', 'broker_binlog_local', rand())
SummingMergeTree
ClickHouse会将所有具有相同主键(或更准确地说, 具有相同sorting key)的行替换为包含具有数字数据类型的列的汇总值的一行
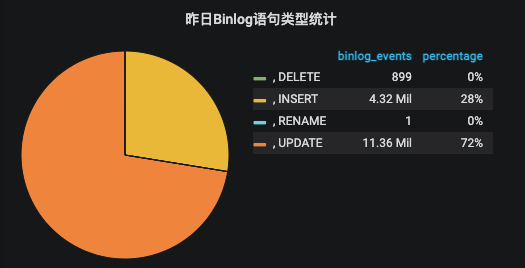
用于统计每日整体binlog event类型占比
-- 物化视图基表
CREATE TABLE mysql_monitor.broker_daily_binlog_event_count_local ON CLUSTER ch_cluster_all
(
    `day` Date,
    `event_type` String,
    `event_count` UInt64
)
ENGINE = ReplicatedSummingMergeTree('/clickhouse/mysql_monitor/tables/{layer}-{shard}/broker_daily_binlog_event_count', '{replica}')
PARTITION BY day
ORDER BY (day, event_type)
TTL day + toIntervalMonth(30)
SETTINGS index_granularity = 8192

-- 本地物化视图
CREATE MATERIALIZED VIEW mysql_monitor.broker_daily_binlog_event_count_mv_local ON CLUSTER ch_cluster_all TO mysql_monitor.broker_daily_binlog_event_count_local
(
    `day` Date,
    `event_type` String,
    `event_count` UInt64
) AS
SELECT
    toDate(execute_time) AS day,
    event_type,
    count(*) AS event_count
FROM mysql_monitor.broker_binlog_local
GROUP BY
    day,
    event_type
ORDER BY
    day ASC,
    event_type ASC

-- 分布式物化视图
CREATE TABLE mysql_monitor.broker_daily_binlog_event_count_mv ON CLUSTER ch_cluster_all
(
    `day` Date,
    `event_type` String,
    `event_count` UInt64
)
ENGINE = Distributed('ch_cluster_all', 'mysql_monitor', 'broker_daily_binlog_event_count_mv_local', rand())
-- 物化视图基表
CREATE TABLE mysql_monitor.broker_daily_binlog_event_count_by_table_local ON CLUSTER ch_cluster_all
(
`day` Date,
`schema` String,
`table` String,
`event_type` String,
`event_count` UInt64
)
ENGINE = ReplicatedSummingMergeTree('/clickhouse/mysql_monitor/tables/{layer}-{shard}/broker_daily_binlog_event_count_by_table', '{replica}')
PARTITION BY day
ORDER BY (day, table, schema, event_type)
TTL day + toIntervalMonth(30)
SETTINGS index_granularity = 8192
-- 本地物化视图
CREATE MATERIALIZED VIEW mysql_monitor.broker_daily_binlog_event_count_by_table_mv_local ON CLUSTER ch_cluster_all TO mysql_monitor.broker_daily_binlog_event_count_by_table_local
(
`day` Date,
`schema` String,
`table` String,
`event_type` String,
`event_count` UInt64
) AS
SELECT
toDate(execute_time) AS day,
schema,
table,
event_type,
count(*) AS event_count
FROM mysql_monitor.broker_binlog_local
GROUP BY
day,
schema,
table,
event_type
ORDER BY
day ASC,
schema ASC,
table ASC,
event_type DESC
-- 分布式物化视图
CREATE TABLE mysql_monitor.broker_daily_binlog_event_count_by_table_mv ON CLUSTER ch_cluster_all
(
`day` Date,
`schema` String,
`table` String,
`event_type` String,
`event_count` UInt64
)
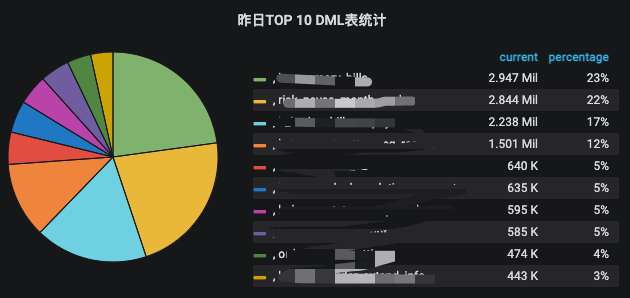
ENGINE = Distributed('ch_cluster_all', 'mysql_monitor', 'broker_daily_binlog_event_count_by_table_mv_local', rand())主要就是为了增加table信息, 可以按表维度统计分析

统计影响行数对多的事务, 产生binlog最大的事务, 执行时间最长的事务
CREATE TABLE mysql_monitor.broker_largest_transaction_local ON CLUSTER ch_cluster_all
(
    `end_time` DateTime COMMENT '采集语句中的end_time',
    `invertal` String COMMENT '采集周期,单位秒',
    `gtid` String COMMENT 'gtid',
    `transaction_spend_time` Int32 COMMENT '事务用时',
    `transaction_size` Int64 COMMENT '事务size',
    `single_statement_affected_rows` UInt64 COMMENT '事务影响行数'
)
ENGINE = ReplicatedSummingMergeTree('/clickhouse/mysql_monitor/tables/{layer}-{shard}/broker_largest_transaction', '{replica}')
PARTITION BY toDate(end_time)
ORDER BY gtid
TTL toDate(end_time) + toIntervalMonth(30)
SETTINGS index_granularity = 8192

CREATE TABLE mysql_monitor.broker_largest_transaction ON CLUSTER ch_cluster_all
(
    `end_time` DateTime COMMENT '采集语句中的end_time',
    `invertal` String COMMENT '采集周期,单位秒',
    `gtid` String COMMENT 'gtid',
    `transaction_spend_time` Int32 COMMENT '事务用时',
    `transaction_size` Int64 COMMENT '事务size',
    `single_statement_affected_rows` UInt64 COMMENT '事务影响行数'
)
ENGINE = Distributed('ch_cluster_all', 'mysql_monitor', 'broker_largest_transaction_local', rand())

CREATE TABLE mysql_monitor.broker_most_time_consuming_transaction_local ON CLUSTER ch_cluster_all
(
    `end_time` DateTime COMMENT '采集语句中的end_time',
    `invertal` String COMMENT '采集周期,单位秒',
    `gtid` String COMMENT 'gtid',
    `transaction_spend_time` Int32 COMMENT '事务用时',
    `transaction_size` Int64 COMMENT '事务size',
    `single_statement_affected_rows` UInt64 COMMENT '事务影响行数'
)
ENGINE = ReplicatedSummingMergeTree('/clickhouse/mysql_monitor/tables/{layer}-{shard}/broker_most_time_consuming_transaction', '{replica}')
PARTITION BY toDate(end_time)
ORDER BY gtid
TTL toDate(end_time) + toIntervalMonth(30)
SETTINGS index_granularity = 8192

CREATE TABLE mysql_monitor.broker_most_time_consuming_transaction ON CLUSTER ch_cluster_all
(
    `end_time` DateTime COMMENT '采集语句中的end_time',
    `invertal` String COMMENT '采集周期,单位秒',
    `gtid` String COMMENT 'gtid',
    `transaction_spend_time` Int32 COMMENT '事务用时',
    `transaction_size` Int64 COMMENT '事务size',
    `single_statement_affected_rows` UInt64 COMMENT '事务影响行数'
)
ENGINE = Distributed('ch_cluster_all', 'mysql_monitor', 'broker_most_time_consuming_transaction_local', rand())


CREATE TABLE mysql_monitor.broker_most_affected_rows_transaction_local ON CLUSTER ch_cluster_all
(
    `end_time` DateTime COMMENT '采集语句中的end_time',
    `invertal` String COMMENT '采集周期,单位秒',
    `gtid` String COMMENT 'gtid',
    `transaction_spend_time` Int32 COMMENT '事务用时',
    `transaction_size` Int64 COMMENT '事务size',
    `single_statement_affected_rows` UInt64 COMMENT '事务影响行数'
)
ENGINE = ReplicatedSummingMergeTree('/clickhouse/mysql_monitor/tables/{layer}-{shard}/broker_most_affected_rows_transaction', '{replica}')
PARTITION BY toDate(end_time)
ORDER BY gtid
TTL toDate(end_time) + toIntervalMonth(30)
SETTINGS index_granularity = 8192

CREATE TABLE mysql_monitor.broker_most_affected_rows_transaction ON CLUSTER ch_cluster_all
(
    `end_time` DateTime COMMENT '采集语句中的end_time',
    `invertal` String COMMENT '采集周期,单位秒',
    `gtid` String COMMENT 'gtid',
    `transaction_spend_time` Int32 COMMENT '事务用时',
    `transaction_size` Int64 COMMENT '事务size',
    `single_statement_affected_rows` UInt64 COMMENT '事务影响行数'
)
ENGINE = Distributed('ch_cluster_all', 'mysql_monitor', 'broker_most_affected_rows_transaction_local', rand())
想了想只能建三张表, 写脚本自己周期性查询size,耗时, 影响行数最多的在插入这些表中
查询语句大致如下, 由于grafana必须需要一个DateTime列, 所以加了一个toDateTime('{end}') 取每次采集窗口的高水位. 三个查询只是order by不同
SELECT
    toDateTime('{end}'),
    '{str(interval)}',
    gtid,
    max(execute_time) - min(execute_time) AS transaction_spend_time,
    (max(toUInt32(binlog_pos)) - min(toUInt32(binlog_pos))) + argMax(toUInt32(single_statement_size), toUInt32(binlog_pos)) AS transaction_size,
    sum(single_statement_affected_rows) AS single_statement_affected_rows
FROM mysql_monitor.{prefix}_binlog
WHERE (execute_time >= '{start}') AND (execute_time < '{end}')
GROUP BY gtid
ORDER BY transaction_spend_time DESC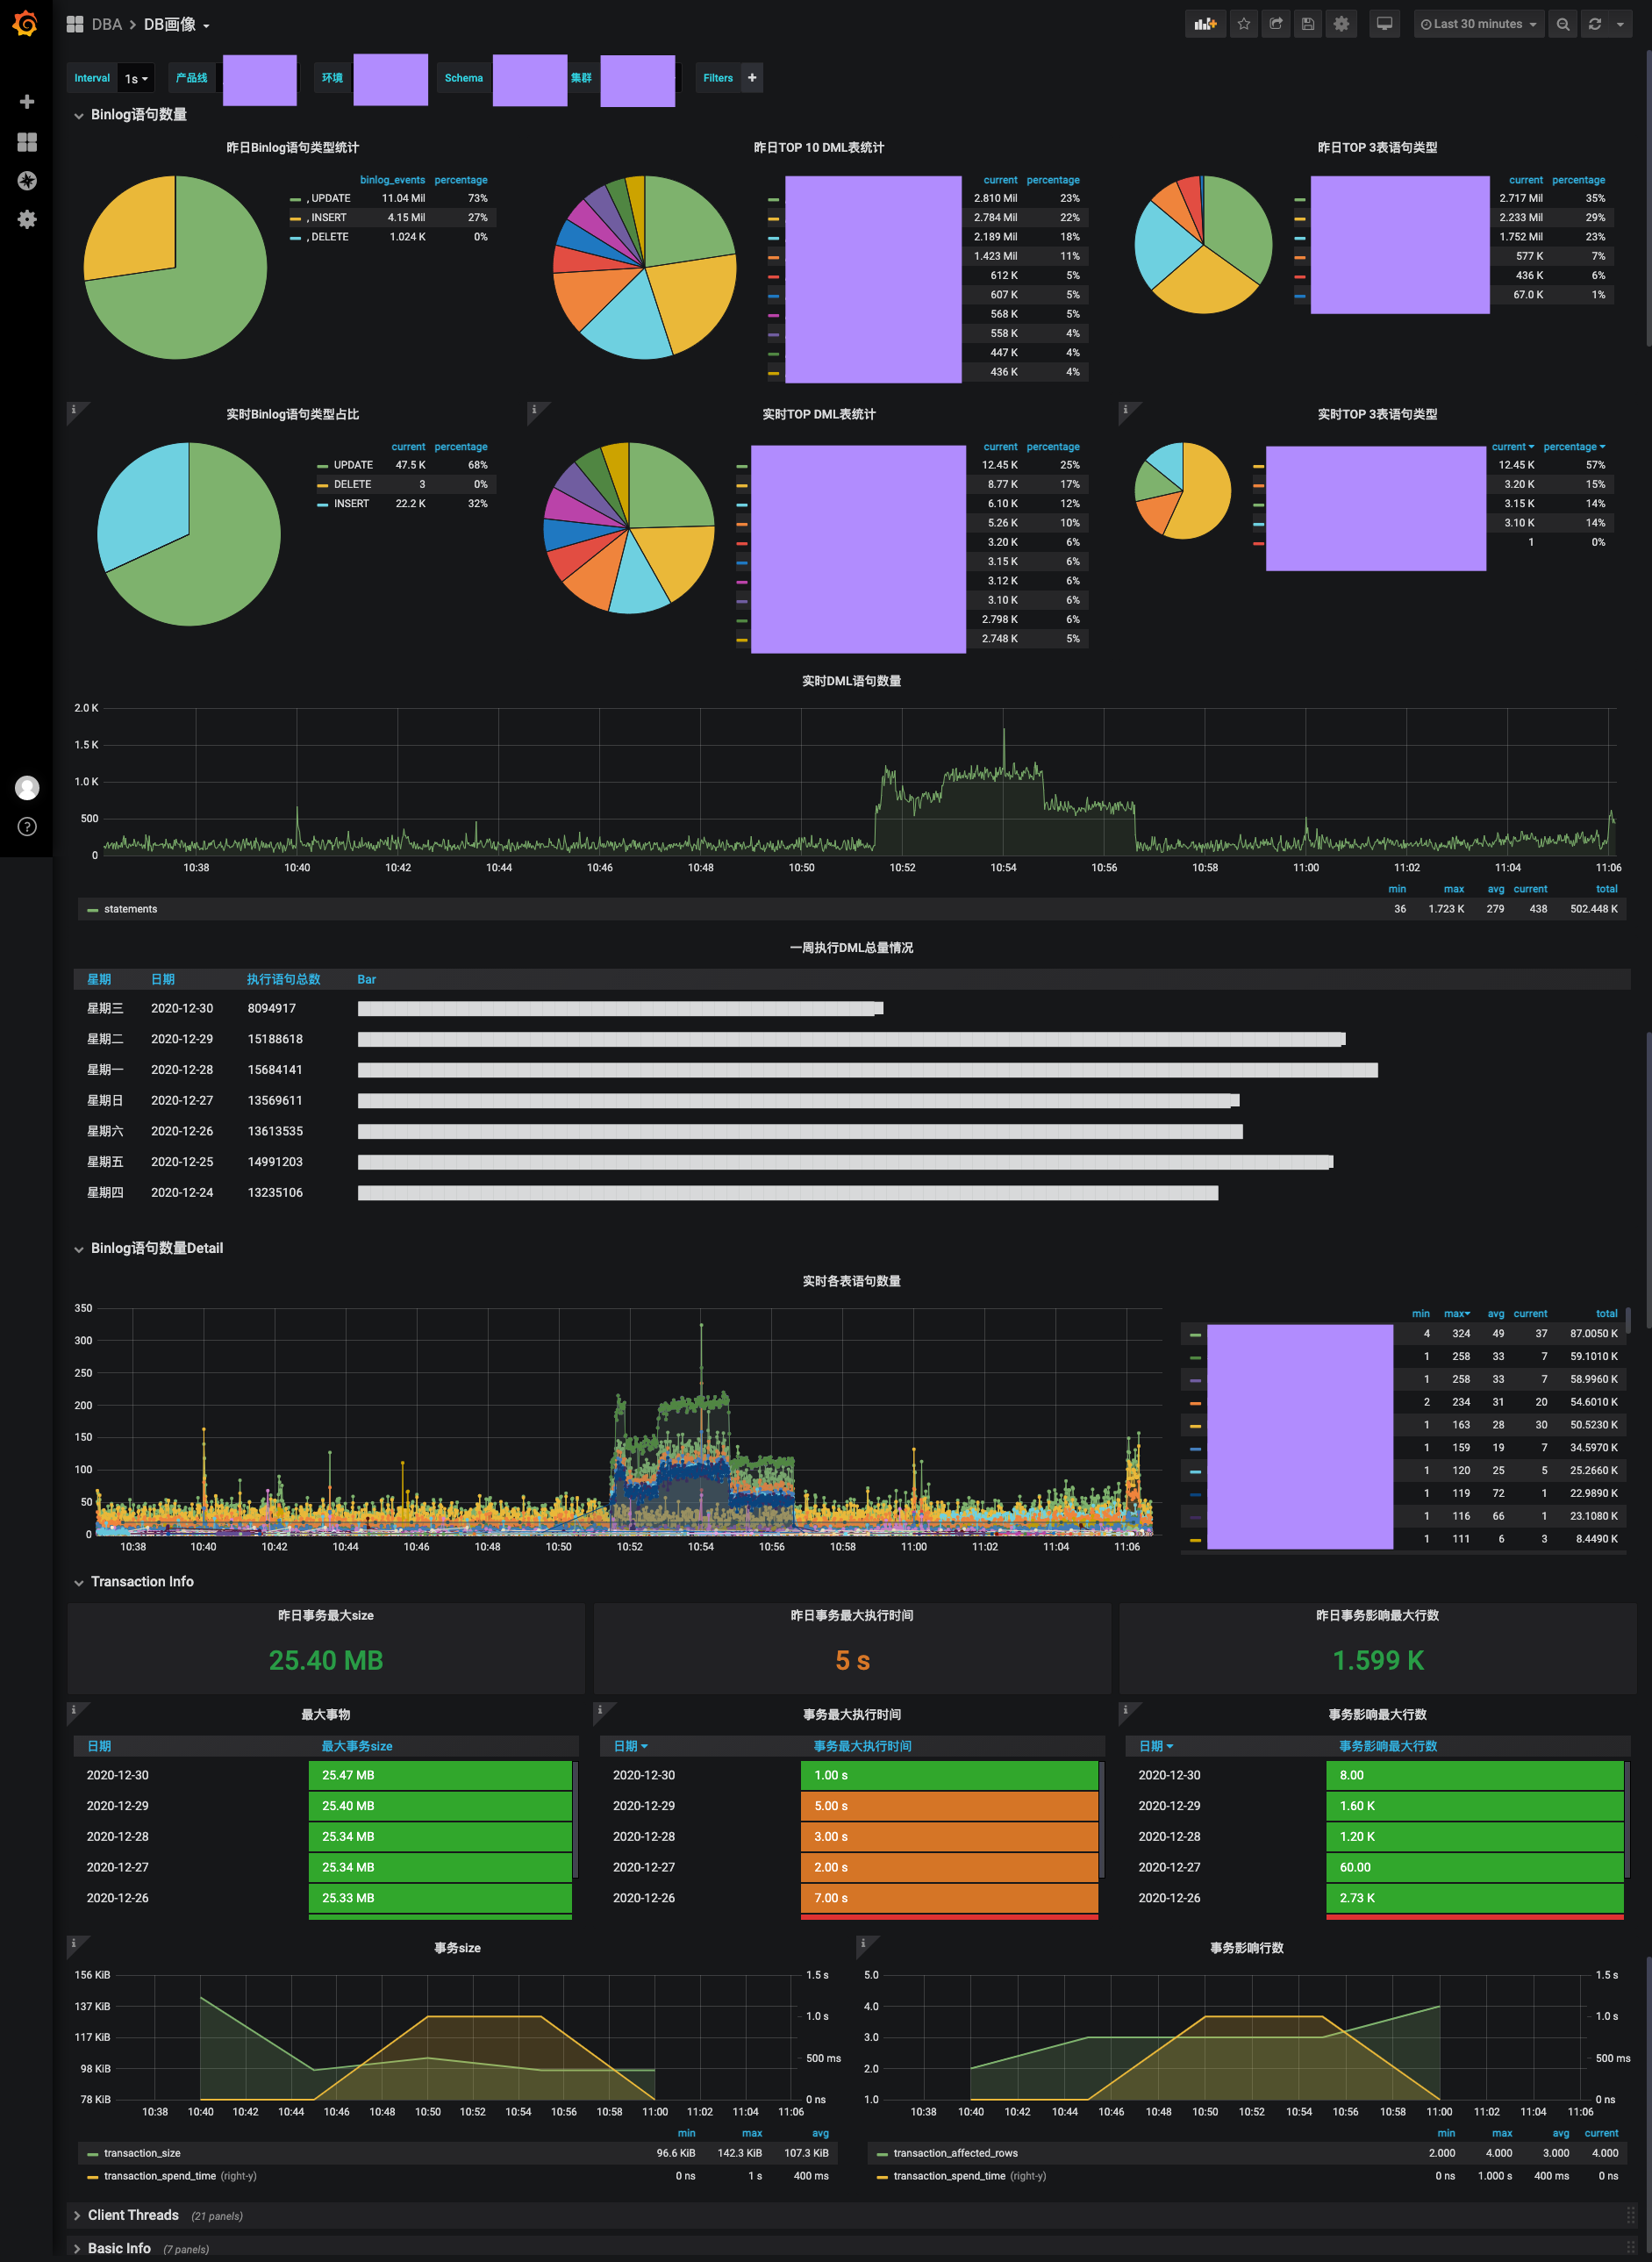
LIMIT 1目前实现的只是画像的一部分. 任何能够描绘一个数据库"样貌"的信息都可以作为画像的一部分. 也许未来还会采集更多信息去更好的描绘一个数据库.
实际干下来发现一些查询确实可以通过物化视图优化, 但是grafana每次都要带一个DateTime比较烦, 可能物化视图还有优化空间. 对于如下图所示的实时统计的需求daily_binlog这种天级物化视图就无法实现细粒度的查询了

那么如何实现更细粒度的物化视图呢? 得看下如何按周期聚合, 比如5分钟一个聚合. 目前clickhouse没有oracle那样的开窗函数
oracle可以
sum over(partition by gtid order by execute_time range between interval '1' day preceding and interval '1' day following)
对于一些不好优化的查询, 如果换马蜂窝那些一天上百G binlog的库可能真的跑不动了. 也许只能多搞几个分片, 不过不知道最后聚合会不会很耗内存, 感觉最主要是这套系统是否值得付出加节点的金钱成本.