
One of the ways you can contribute to this project is by giving anonymized performance test results to further reinforce this solution. The more different results sets we can pull through this heuristic the more weird and exotic things we will find and would have to solve and because of that we would be further improving the algorithm and its application.
There are some requirements around the raw test results sets we would accept to be included in our repository these are the following:
- Data must be in the raw format
- Data must be anonymized and contain no commercial names
- Data must be provided in the csv format with the approved header
- CSV file cannot exceed 20 Mb
- Response times must be in seconds
- A time axis is needed preferably epoch
- The RunID format is needed to categorize the tests
- Your submitted data contains at least 2 stable tests.
- Your submitted data contains at least 1 slower or faster test.
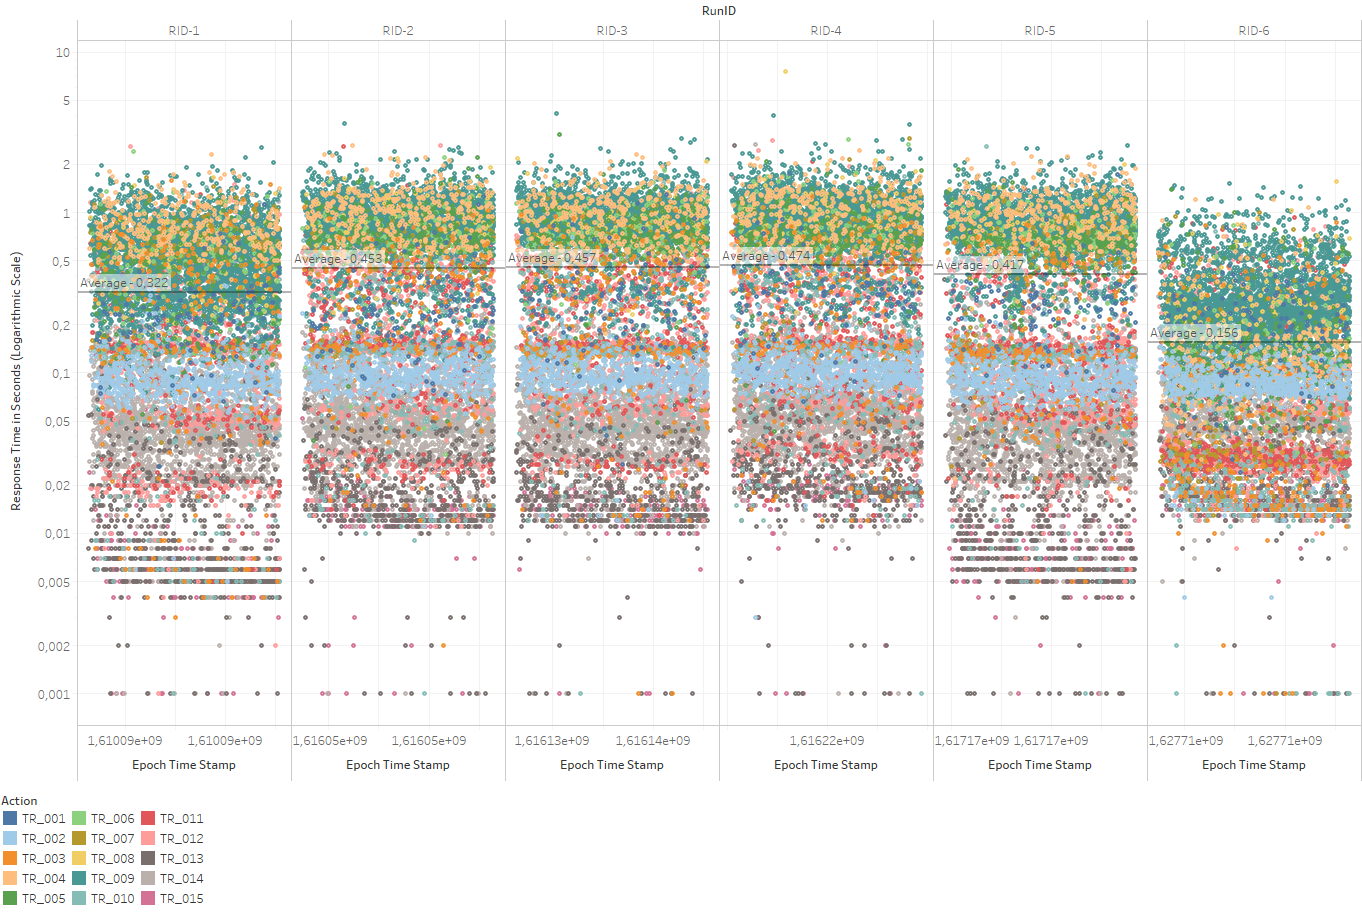
It would be preferably your submission would come with a small description or graph, so we can make sense of your data faster. Below an example from the example data set:
If you are using Neoload, and you want to export your test results you can do this in the following way:

Have any question on how to export your test results then feel free to open up an issue!
Tableau is an amazing BI tool which I use daily to generate dashboards for my test results and interpret difficult data in a fast and no-nonsense way. If you want to include a scatter plot in your submission you can generate one the following way with Tableau:

- Open a issue - Share your raw data - Made for the Performance Advisory Council - Follow me on Linkedin -