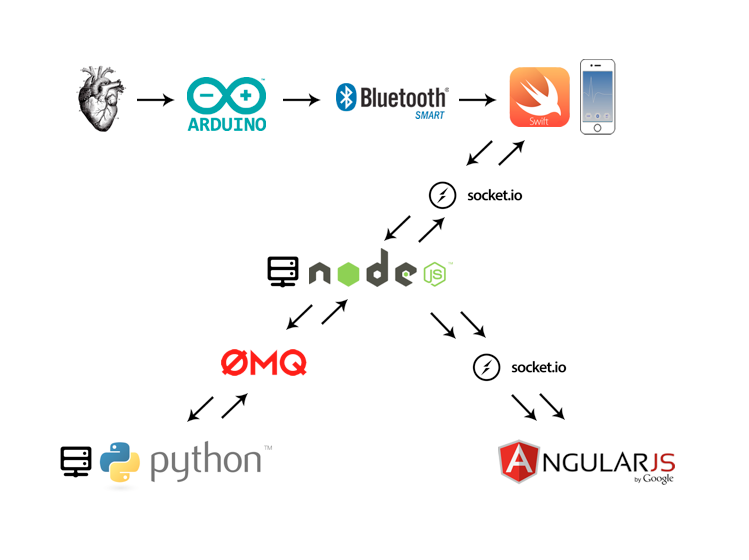
webAppEKGAPI is the face of Kardia. It holds the landing page of the main site, the demo web client, as well as the back end functionality of our sockets. The node.js server communicates with all aspects of Kardia, from the mobile app, the web client, and our number crunching python server. The web client demonstrates to developers how the Kardiak wearable ECG can be used. It explores the realm of creativity and challenges developers to use our resources to create powerful ECG apps.
A straightforward Node.js/Express server that takes on the role of traffic control. It relays data to and from the Mobile Swift app, python server, as well as our demo web client.
Cloudinary allows webAppEKGAPI to use images while not having to store any locally. Rather all images used are stored in Kardia's cloudinary account. All stored images are given a url, which can be referred to when needed.
3Scale is used for third-party API management and authentication. It keeps track of user usage and authenticates users before allowing them access to our API.
3scale is added by requiring and linking our account to the server.
var threeScale = require('3scale').Client;

var threeScaleClient = new threeScale(process.env.THREE_SCALE_CLIENT);
threeScaleClient.authrep({"app_id": process.env.THREE_SCALE_APP_ID, "app_key": process.env.THREE_SCALE_APP_KEY, "usage": { "hits": 1 } }, function(response){
  sys.log(sys.inspect(response));
});
To add authentication, more work will be necessary. You can read this blog post to learn how to do so.
The pythonComm holds all of the websocket logic alongside communication with the python server using ZeroMQ/ZeroRPC.
With sockets, there are two major function calls: .emit(), which triggers an event, and .on(), which listens to an event. Our Swift mobile app emits an event called 'message', while the node.js server waits and listens for the 'message' event. On the event, data will be received in a JSON object, with properties of amplitude and time. The value of amplitude holds a float representing a data point up to 4 significant figures (i.e 4.756); time has value represented in an ISO 8601 format.
When the server hears the 'message' call, it then relays the data to our web app with its own emit labeled '/analysisChart' as well as invokes functions held in our python server, with the data attached.
socket.broadcast.emit('/analysisChart', { "data": data });Using zerorpc's native function invoke, the node server is able to call specific functions that exist in the python server. Here we invoke a function labelled 'crunch' that will take the incoming data and run an analysis over it.
client.invoke('crunch', data, function(error, result, more){
  if (error) {
    console.log('error');
  }
  console.log('data is the info you want to send to the python server')
  console.log('result is what the python server returns');
});
At the end of the crunch, the python server will send back an analysis of the data it had received, emitted through an event called 'node.js'. Anything listening 'on' these emits will receive the result of the 'emit', in this case, it is both the mobile app and the web client.
socket.emit('node.js', result); //emit to swift app

// broadcast allows the emit to be heard by all open sockets
socket.broadcast.emit('node.js', result); //emit to webapp and anything else listeningThe analysis holds and renders data streaming through websockets.
Rickshaw creates interactive d3.js charts. The logic behind the web client demo graph exists within analysis.js, in a variable called graph.
var graph = new Rickshaw.Graph({
  element: element[0],
  width: scope.width,
  height: attrs.height,
  series: [{data: scope.data, color: attrs.color}],
  renderer: scope.renderer,
  min: 2.8,
  max: 7.2
});

graph.render();
The data property in the graph's series is filled with data points streaming in through websockets existing in the AnalysisController and is set to hold up to 25 data points at any time. As data comes in, it is set to a displayData object, and a timestamp property 'x' is added.
socket.on('/analysisChart')

var displayData = {};
displayData.x = count;
count += 0.3;
displayData.y = parseFloat(amplitude);

// Make 25 points at any given time
if ($scope.incoming.length > 25) {
  $scope.incoming.shift();
}

$scope.incoming = $scope.incoming.concat(displayData);
In analysis.html, the rickshaw tag refers its data to $scope.incoming. The rickshaw directive held in analysis.js will then create a $scope.data = incoming, thus rendering the graph constantly with new points.
<rickshaw
  data="incoming"
  color="white"
  renderer="renderer"
  width="width"
  height="200"
></rickshaw>.directive('rickshaw', function(){
return {
scope: {
data: '=',
renderer: '=',
width: '='
},The widgets displayed on analysis.html represent the analysis that is sent by the python server. The very top/left widget refers to a status code that indicates whether the data points represent a normal sinus rhythm(NSR) or an arrythmia(ARR). The one on the very bottom/right will display the calculated heart rate. This data is accessed through the socket.on() call on the event 'node.js', mentioned earlier (See pythonComm.js).
socket.on('node.js', function (statusCode) {
	var status;
	if (statusCode.statusCode === "200") {
	  status = "NSR";
	  $scope.statusTitle = "Normal Sinus Rhythm";
	} else if (statusCode.statusCode === "404") {
	  status = "ARR";
	  $scope.statusTitle = "Arrhythmia";
	}

	$scope.status = status;
	$scope.bpmTitle = 'BPM';
	$scope.bpm = statusCode.heartRate;

	// Animate Icons
	$statusCodeIcon.addClass('faa-spin');
	$bpmIcon.addClass('faa-pulse');
});For documentation regarding our web client demo's authentication, please refer to this page.

