In this script, forest cover maps were used as inputs for the calculation of five landscape metrics using the R package "landscapemetrics", namely:
- percentage of landscape (landscape composition - proportional abundance of the class "Forest Cover")
- number of patches (landscape configuration - aggregation metric (subdivision))
- edge density (landscape configuration - aggregation metric (subdivision))
- splitting index (landscape configuration - aggregation metric (subdivision))
- mean of patch area (landscape composition - area and edge metric)
Each map represents the location of a primate community and forest cover around that community within a 5 km radius. As I had many communities and landscapes the calculation process was automated in a for loop to determine the metric values at different radii (1000m to 5000m every 200m). The script ends by exporting a .csv with the values of each metric, in each of the different radii for each of the communities. It also exports a .png image with the corresponding map and metric values for that map and radius like this one below:
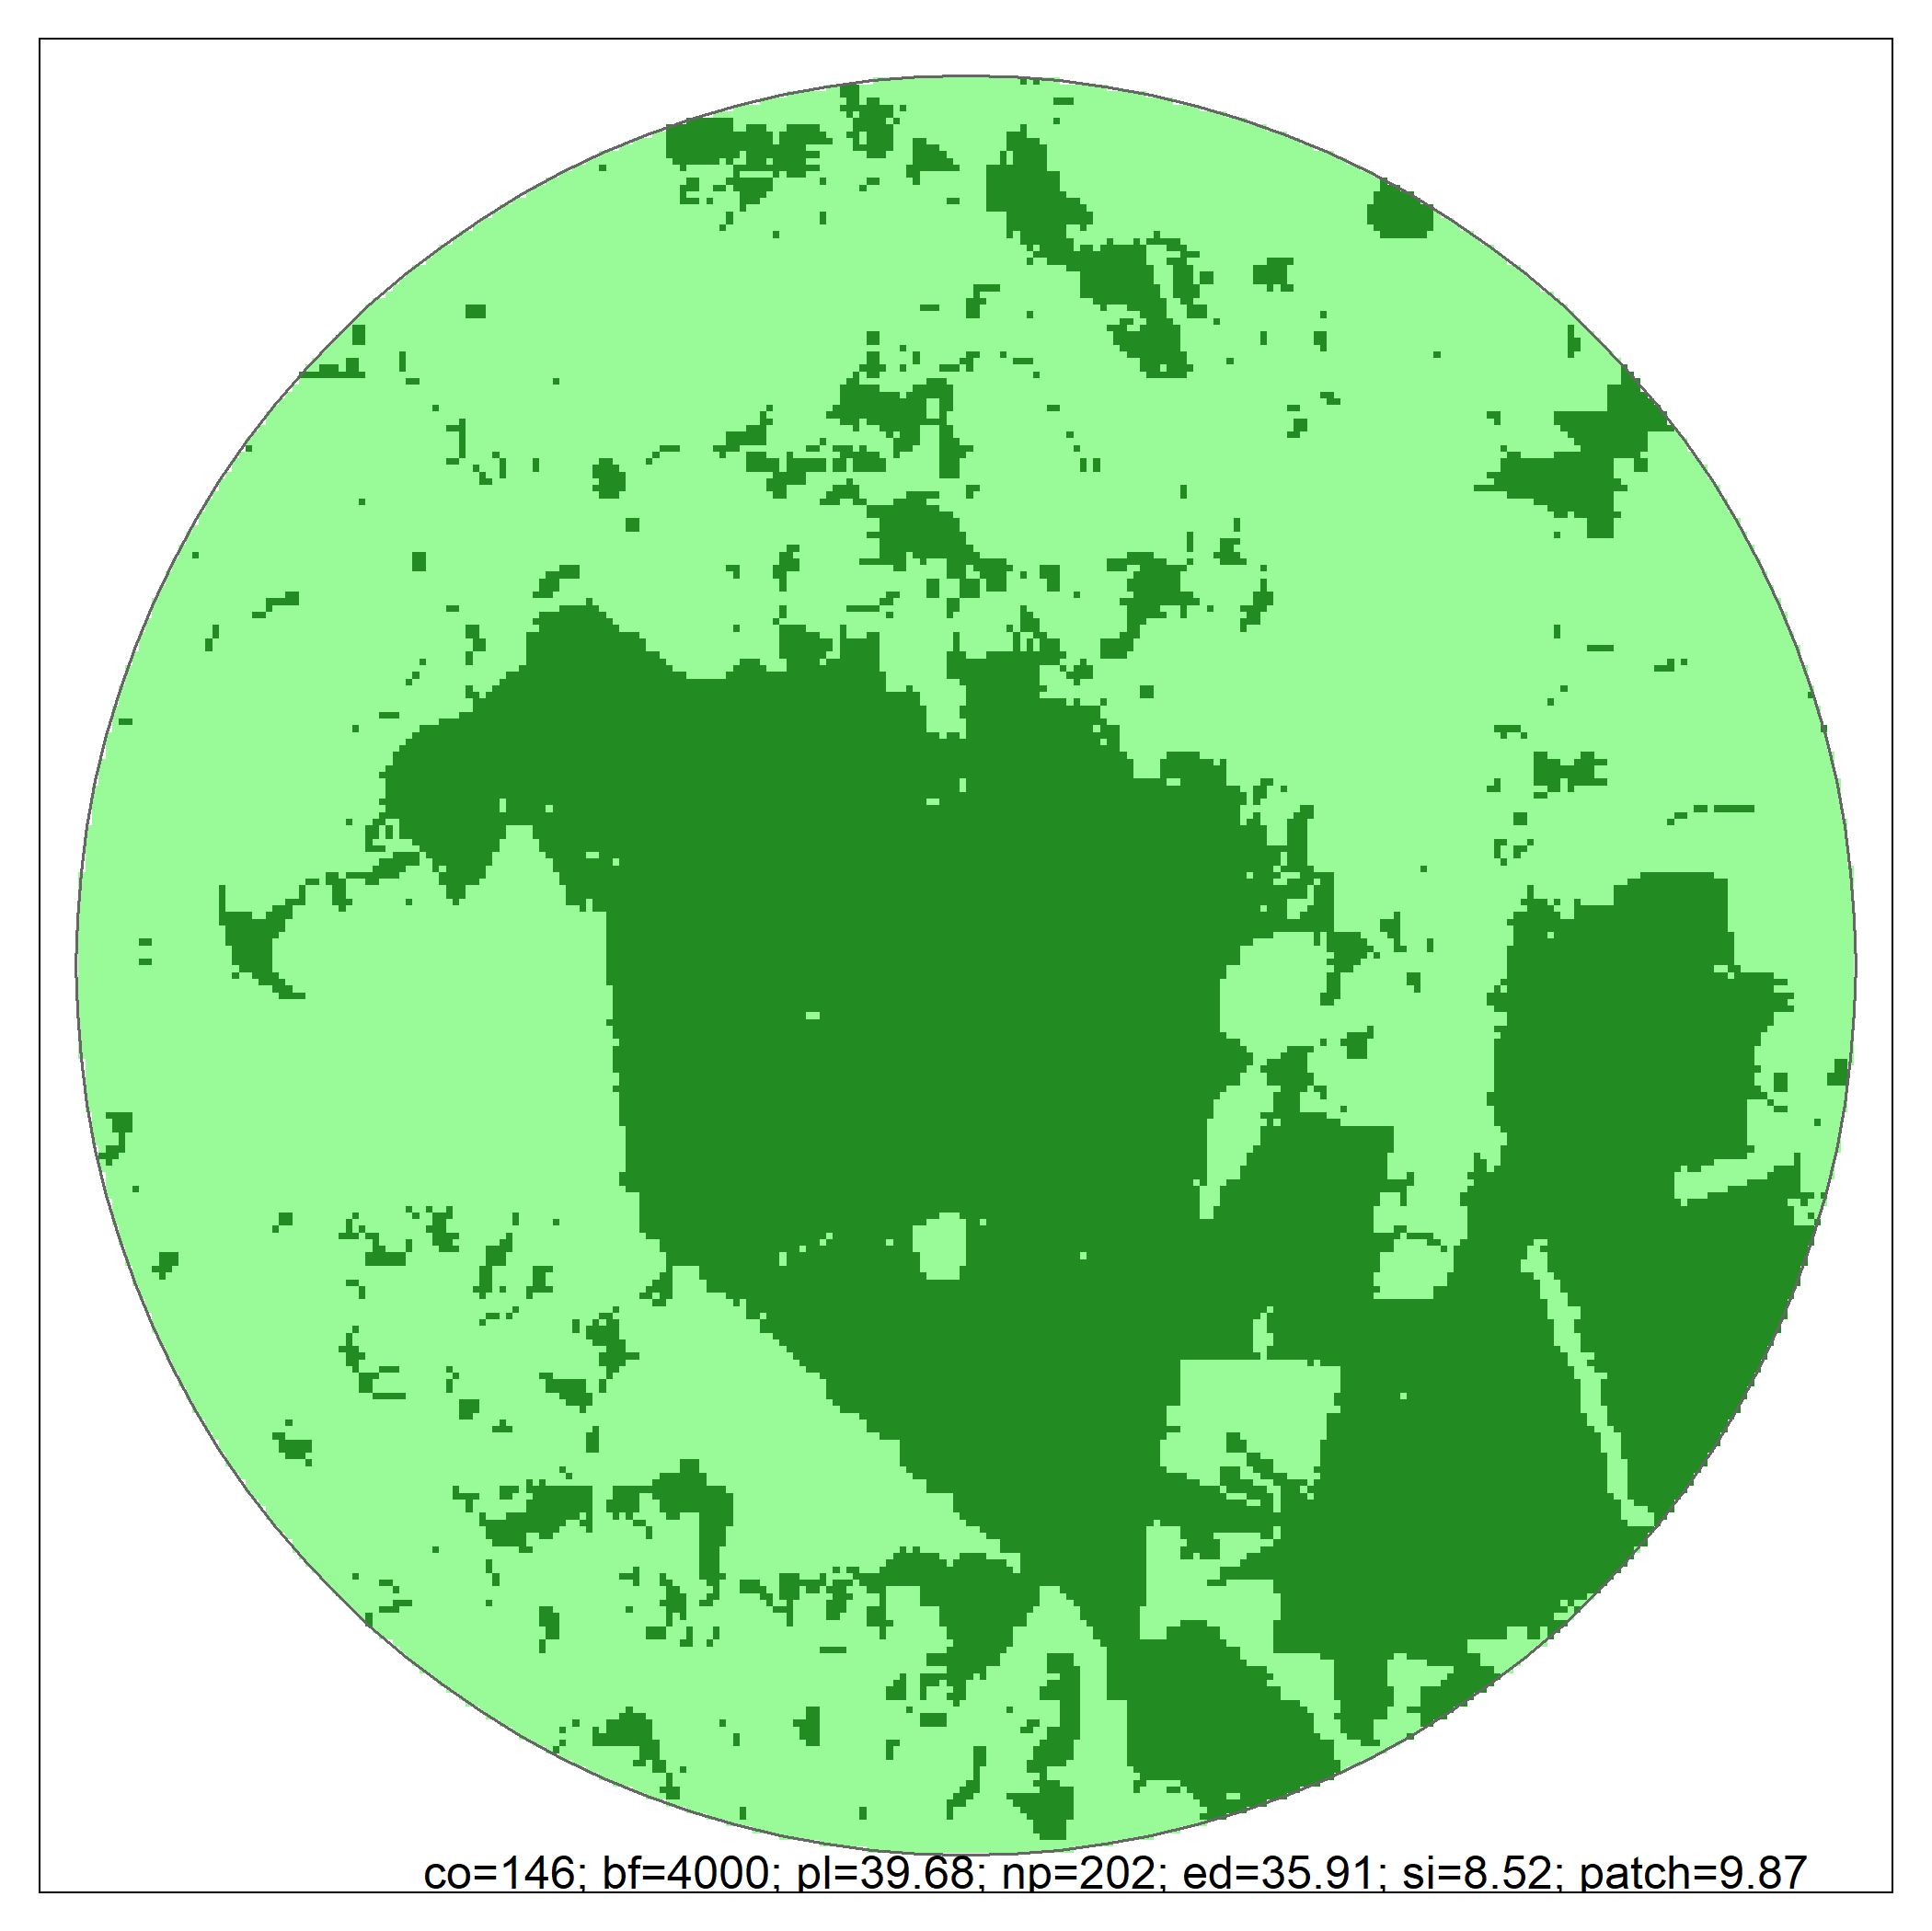
"co" is the community id; "bf" is the buffer radius; "pl" is percentage of landscape; "np" is number of patches; "ed" is edge density; "si" is splitting index; "patch" is mean of patch area.