Metrics and Monitoring
As HystrixCommands and HystrixObservableCommands execute, they generate metrics on execution outcomes and latency. These are very useful to operators of the system, as they give a great deal of insight into how the system is behaving. Hystrix offers metrics per command key and to very fine granularities (on the order of seconds).
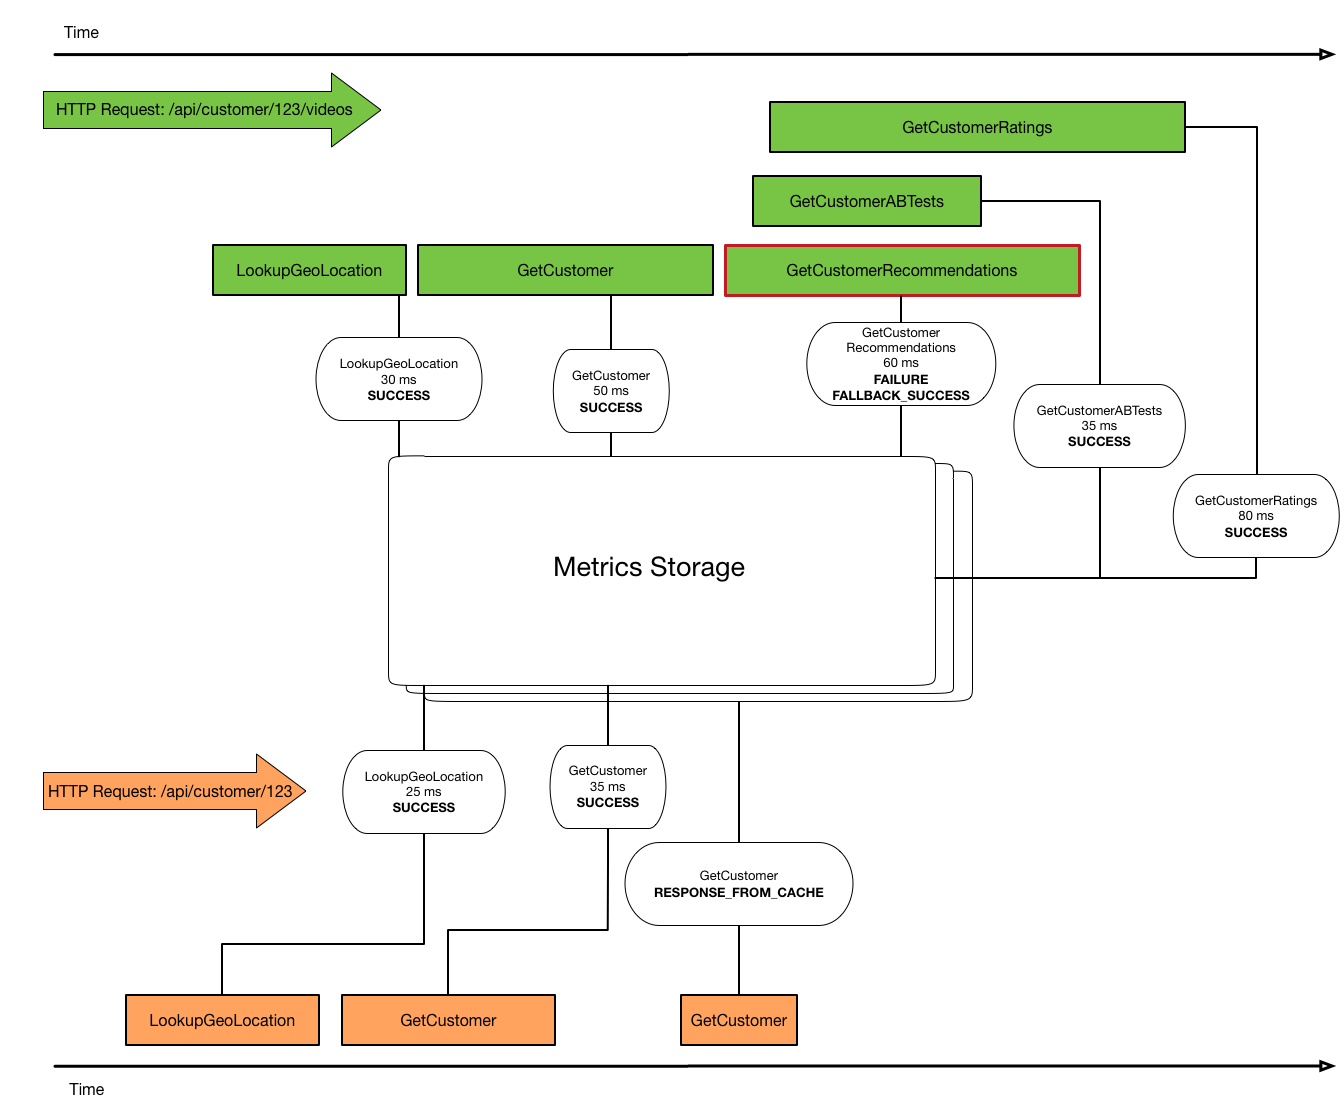
These metrics are useful both individually, and in aggregate. Getting the set of commands that executed in a request, along with outcomes and latency information, is often helpful in debugging. Aggregate metrics are useful in understanding overall system-level behavior, and are appropriate for alerting or reporting. The Hystrix Dashboard is one such consumer.
Here's an illustration of commands executing and writing metrics :
 (Click for larger view.)
The complete set of Hystrix command event types is specified in the table below. These correspond to the enum com.netflix.hystrix.HystrixEventType. These types are shared between HystrixCommand and HystrixObservableCommand.
In a HystrixCommand, only single values are returned, so there is 1 event types for execution, and, if necessary, 1 event type for fallback. So a SUCCESS implies a value return and the completion of the command.
In a HystrixObservableCommand, [0..n] values may be returned, so the EMIT event corresponds to a value returned, and the other execution events correspond to the command terminating. If you're familiar with RxJava, EMIT is equivalent to OnNext, SUCCESS is equivalent to OnCompleted, and FAILURE is equivalent to OnError.
| Name | Description | Triggers Fallback? |
|---|---|---|
| EMIT | value delivered (HystrixObservableCommand only) |
NO |
| SUCCESS | execution complete with no errors | NO |
| FAILURE | execution threw an Exception | YES |
| TIMEOUT | execution started, but did not complete in the allowed time | YES |
| BAD_REQUEST | execution threw a HystrixBadRequestException
|
NO |
| SHORT_CIRCUITED | circuit breaker OPEN, execution not attempted | YES |
| THREAD_POOL_REJECTED | thread pool at capacity, execution not attempted | YES |
| SEMAPHORE_REJECTED | semaphore at capacity, execution not attempted | YES |
| Name | Description | Throws Exception? |
|---|---|---|
| FALLBACK_EMIT | fallback value delivered (HystrixObservableCommand only) |
NO |
| FALLBACK_SUCCESS | fallback execution complete with no errors | NO |
| FALLBACK_FAILURE | fallback execution threw an error | YES |
| FALLBACK_REJECTION | fallback semaphore at capacity, fallback not attempted | YES |
| FALLBACK_MISSING | no fallback implemented | YES |
| Name | Description |
|---|---|
| EXCEPTION_THROWN | was an exception thrown by the overall command execution? |
| RESPONSE_FROM_CACHE | was the command able to be looked up in cache? If so, execution did not occur |
| COLLAPSED | was the command a result of a collapser batch? |
| Name | Description |
|---|---|
| EXECUTED | thread pool has space and allowed the command to run |
| REJECTED | thread pool had no room, and rejected the command |
| Name | Description |
|---|---|
| BATCH_EXECUTED | batch generated by collapser and batch command invoked |
| ADDED_TO_BATCH | argument added to collapser batch |
| RESPONSE_FROM_CACHE | argument not added to collapser batch, because it was found in request cache |
When the metrics get generated, they need to get stored for some period of time before they get pushed off-box and into a different system. The alternative is to always stream metrics directly off-box, and this is unlikely to perform well unless the volume is very low. Instead, the approach Hystrix chooses is to write the metrics to in-memory data structures. These store metrics and allow for querying at some later point.
The specific data structures that store metrics changed in Hystrix 1.5.0.
In Hystrix versions up to 1.4.x, metrics are written to aggregating data structures. A HystrixRollingNumber captures counts of events and a HystrixRollingPercentile captures observations of quantities that have interesting distributions. For example, command latency and collapser batch size are tracked using a HystrixRollingPercentile. Metrics are written to these data structures synchronously as the command executes. These data structures support a rolling model, where only the most recent metrics are kept.
As commands start executing, these data structures get initialized. HystrixRollingNumbers take 2 pieces of config: number of buckets, and overall window of metrics to track. Call the number of buckets n and the overall window w (in milliseconds). Then call t (= w/n) the bucket size (in milliseconds). Given that config, writes always go into the newest bucket, and reads go against this "hot" bucket and the previous n-1 buckets. Since only n buckets are needed at a time, the data structure re-uses old buckets to save on memory allocation. Because all of the writes are synchronous, there's no background work that does this "bucket rolling". Instead, one unlucky write per bucket pays the cost of doing the work of updating pointers and getting a new bucket ready for writing. This data structure permits any threads to write, so has internal synchronization logic to allow this to occur safely, without external synchronization.
Configuration of n and w are exposed at Number of Buckets Config and Overall window config
Please also see those config links for an illustration of how the rolling number does bucketing.
The HystrixRollingPercentile is similar. It shares the bucketing semantics of HystrixRollingNumber, and has the additional configuration of the maximum number of observations in a bucket. Reads of this data structure can be a mean or arbitrary percentile of the distribution. In this case, the distribution is calculated over the "hot" bucket and the previous n-1 buckets.
Configuration of n and w are exposed at Number of Buckets Config and Overall window config. The maximum count per bucket is exposed at Maximum count config
With these data structures, it's straightforward to ask for aggregate values. You may ask a HystrixRollingNumber for a rolling count of SUCCESS, or a HystrixRollingPercentile for a rolling mean, for example. The Hystrix Circuit Breaker is based on the rolling count of successes vs failures, for instance. All of the metrics publishers and streams in hystrix-contrib read these rolling counts and publish aggregate info off-box.
However, the story is more complicated with any level of detail past this. Because reads only return these aggregated values, we have no ability to do any faceting. For example, knowing that FooCommand is failing at 50% in aggregate is interesting, but I'd also like the ability to know that it's failing at 0% in Mexico and Brazil, and 98% in the United States. That level of detail is lost when we strictly do aggregates.
As a result, internally at Netflix, we've started to parse the HystrixRequestLog, and then use this for further analysis. The HystrixRequestLog tracks all events in a request, and makes them available as a string. This is not optimal, but makes a few things possible. We can take a peek at this value at the end of every HTTP request, and then push out this data along with all other contextual information in the HTTP request. This makes it possible to do things like partition the Hystrix outcomes/latency by HTTP path, which we've found to be valuable.
As a result of this insight, we've redesigned how metrics can get consumed to allow for more flexibility. If metrics are modeled as a first-class stream, they may be consumed in any arbitrary way. To do this, we build streams for each metric. Each HystrixCommandKey has a start-event and completion-event stream that may be subscribed to, as does each HystrixThreadPoolKey. Each HystrixCollapserKey has a stream dedicated to collapser actions.
To maintain backward compatibility (and verify that this abstraction holds water), hystrix-core provides implementations of all of the aggregated queries possible against HystrixRollingNumber/HystrixRollingPercentile, except calculated against these streams. This has a few benefits. Instead of maintaining complex code within Hystrix, we depend on RxJava for thread-safe implementations of aggregating operations. As an example, bucketing by time is implementing using Observable.window. This operates on a background thread, so we now get "bucket-rolling" behavior on a background thread for free without having to implement it ourselves.
To create this abstraction, each command no longer emits into a Command-scoped HystrixRollingNumber. Instead, it emits into a thread-local rx.Subject. This is done to allow writes to occur without any synchronization. From there, each event gets written to a command-specific, threadpool-specific or collapser-specific rx.Subject. These Subjects then are exposed as Observables in the Hystrix public API as follows:
| Class | Method | Return Type |
|---|---|---|
HystrixCommandStartStream |
observe() |
Observable<HystrixCommandExecutionStarted> |
HystrixCommandCompletionStream |
observe() |
Observable<HystrixCommandCompletion> |
HystrixThreadPoolStartStream |
observe() |
Observable<HystrixCommandExecutionStarted> |
HystrixThreadPoolCompletionStream |
observe() |
Observable<HystrixCommandCompletion> |
HystrixCollapserEventStream |
observe() |
Observable<HystrixCollapserEvent> |
HystrixRequestEventsStream |
observe() |
Observable<HystrixRequestEvents> |
Hystrix users may create any metrics strategy that's most appropriate for their domain. A few default implementation are provided. An example is RollingCommandEventCounterStream. Any thread may synchronously read the latest rolling value from this stream, which is getting written to in the background as buckets roll by.
Here are the provided metrics consumers, and how they may be invoked:
These count events by type. Commands, threadpools, and collapsers each have different types: [#hystrix-event-types](HystrixEventType, HystrixEventType.ThreadPool, and HystrixEventType.Collapser, respectively)
Rolling counters only consider the last n buckets, just like the HystrixRollingNumber/Percentile above. Cumulative counters consider all events since the start of the JVM.
These counters may be treated as a stream by invoking Observable<long[]> observe(). This returns a long array on every bucket roll. By using the appropriate event type enum's ordinal as an index into the long array, you can find the count of any event type.
They may be also read synchronously. In this case, you're guaranteed to read the most-recently calculated value. This doesn't include the bucket being currently written to. In this case, you can invoke long[] getLatest() for the entire set of counts, or long getLatest(HystrixEventType) for a specific event type.
These keep track of the high-water mark of concurrency in a given time period. This has only a rolling version, as a cumulative counter would provide very little information. This is tracked for commands and threadpools.
These counters may be treated as a stream by invoking Observable<Integer> observe(). This returns the maximum concurrency witnessed in the last n buckets of observations and is emitted on every bucket roll.
They may also be read synchronously, using int getLatest() for the most recently calculated value.
These keep track of a set of observations and allow queries on the aggregated distribution over a rolling window. This is tracked for command latency, command user latency, and collapser batch size.
These counters may be treated as a stream by invoking Observable<CachedValuesHistogram> observe() This returns the latest aggregate histogram, which you can then further query.
They may also be read synchronously, using CachedValuesHistogram getLatest for the most recent histogram, int getLatestMean() for the latest mean, and int getLatestPercentile(long percentile) for the most recent percentile.
This is an area where we think the community will have a lot of great ideas that we haven't thought of yet. Please let us know if you're using metrics in a specific way for your domain - we'd love to hear your experience. Even better, feel free to submit your work as an example or a hystrix-contrib module.
In addition to event streams, there are metrics that live outside of any given event that are useful in understanding the system. All of these are new, as of 1.5.0
Configuration has a different lifecycle than any command or request. It's often useful to understand the global configuration picture, so 1.5.0 has introduced a dedicated configuration stream (com.netflix.hystrix.config.HystrixConfigurationStream). This class knows how to look up all current configuration values, then attaches them to a timer, to make it into a stream
Hystrix provides a mapping of these object into JSON at com.netflix.hystrix.contrib.sample.stream.HystrixConfigurationJsonStream and an embedding of this stream into an SSE servlet at com.netflix.hystrix.contrib.sample.stream.HystrixConfigSseServlet (both in hystrix-metrics-event-stream contrib module. You're free to consume the stream using these models, or invent your own. #1062 and #1063 provide some future directions that we believe will be better, performance-wise.
Here's what output of this SSE stream looks like for the hystrix-examples-webapp:
data: {"type":"HystrixConfig","commands":{"CreditCardCommand":{"threadPoolKey":"CreditCard","groupKey":"CreditCard","execution":{"isolationStrategy":"THREAD","threadPoolKeyOverride":null,"requestCacheEnabled":true,"requestLogEnabled":true,"timeoutEnabled":true,"fallbackEnabled":true,"timeoutInMilliseconds":3000,"semaphoreSize":10,"fallbackSemaphoreSize":10,"threadInterruptOnTimeout":true},"metrics":{"healthBucketSizeInMs":500,"percentileBucketSizeInMilliseconds":60000,"percentileBucketCount":10,"percentileEnabled":true,"counterBucketSizeInMilliseconds":10000,"counterBucketCount":10},"circuitBreaker":{"enabled":true,"isForcedOpen":false,"isForcedClosed":false,"requestVolumeThreshold":20,"errorPercentageThreshold":50,"sleepInMilliseconds":5000}},"GetUserAccountCommand":{"threadPoolKey":"User","groupKey":"User","execution":{"isolationStrategy":"THREAD","threadPoolKeyOverride":null,"requestCacheEnabled":true,"requestLogEnabled":true,"timeoutEnabled":true,"fallbackEnabled":true,"timeoutInMilliseconds":50,"semaphoreSize":10,"fallbackSemaphoreSize":10,"threadInterruptOnTimeout":true},"metrics":{"healthBucketSizeInMs":500,"percentileBucketSizeInMilliseconds":60000,"percentileBucketCount":10,"percentileEnabled":true,"counterBucketSizeInMilliseconds":10000,"counterBucketCount":10},"circuitBreaker":{"enabled":true,"isForcedOpen":false,"isForcedClosed":false,"requestVolumeThreshold":20,"errorPercentageThreshold":50,"sleepInMilliseconds":5000}},"GetOrderCommand":{"threadPoolKey":"Order","groupKey":"Order","execution":{"isolationStrategy":"THREAD","threadPoolKeyOverride":null,"requestCacheEnabled":true,"requestLogEnabled":true,"timeoutEnabled":true,"fallbackEnabled":true,"timeoutInMilliseconds":1000,"semaphoreSize":10,"fallbackSemaphoreSize":10,"threadInterruptOnTimeout":true},"metrics":{"healthBucketSizeInMs":500,"percentileBucketSizeInMilliseconds":60000,"percentileBucketCount":10,"percentileEnabled":true,"counterBucketSizeInMilliseconds":10000,"counterBucketCount":10},"circuitBreaker":{"enabled":true,"isForcedOpen":false,"isForcedClosed":false,"requestVolumeThreshold":20,"errorPercentageThreshold":50,"sleepInMilliseconds":5000}},"GetPaymentInformationCommand":{"threadPoolKey":"PaymentInformation","groupKey":"PaymentInformation","execution":{"isolationStrategy":"THREAD","threadPoolKeyOverride":null,"requestCacheEnabled":true,"requestLogEnabled":true,"timeoutEnabled":true,"fallbackEnabled":true,"timeoutInMilliseconds":1000,"semaphoreSize":10,"fallbackSemaphoreSize":10,"threadInterruptOnTimeout":true},"metrics":{"healthBucketSizeInMs":500,"percentileBucketSizeInMilliseconds":60000,"percentileBucketCount":10,"percentileEnabled":true,"counterBucketSizeInMilliseconds":10000,"counterBucketCount":10},"circuitBreaker":{"enabled":true,"isForcedOpen":false,"isForcedClosed":false,"requestVolumeThreshold":20,"errorPercentageThreshold":50,"sleepInMilliseconds":5000}}},"threadpools":{"User":{"coreSize":8,"maxQueueSize":-1,"queueRejectionThreshold":5,"keepAliveTimeInMinutes":1,"counterBucketSizeInMilliseconds":10000,"counterBucketCount":10},"CreditCard":{"coreSize":8,"maxQueueSize":-1,"queueRejectionThreshold":5,"keepAliveTimeInMinutes":1,"counterBucketSizeInMilliseconds":10000,"counterBucketCount":10},"Order":{"coreSize":8,"maxQueueSize":-1,"queueRejectionThreshold":5,"keepAliveTimeInMinutes":1,"counterBucketSizeInMilliseconds":10000,"counterBucketCount":10},"PaymentInformation":{"coreSize":8,"maxQueueSize":-1,"queueRejectionThreshold":5,"keepAliveTimeInMinutes":1,"counterBucketSizeInMilliseconds":10000,"counterBucketCount":10}},"collapsers":{}}
Likewise, utilization of shared resources like semaphores and threadpools is often important to reason about. 1.5.0 introduces a stream which samples utilization values. By sampling these values, you can gain insight into the utilization distribution, which should help influence configuration decisions. I'd like to eventually consider this as part of a feedback loop which can directly affect configuration, but that work has not started yet. See #131
The utilization stream is modeled at com.netflix.hystrix.metric.sample.HystrixUtilizationStream. It is mapped into JSON at com.netflix.hystrix.contrib.sample.stream.HystrixUtilizationJsonStream and embedded in an SSE servlet at com.netflix.hystrix.contrib.sample.stream.HystrixUtilizationSseServlet.
Here's what output of this SSE stream looks like for the hystrix-examples-webapp :
data: {"type":"HystrixUtilization","commands":{"CreditCardCommand":{"activeCount":0},"GetUserAccountCommand":{"activeCount":0},"GetOrderCommand":{"activeCount":1},"GetPaymentInformationCommand":{"activeCount":0}},"threadpools":{"User":{"activeCount":0,"queueSize":0,"corePoolSize":8,"poolSize":2},"CreditCard":{"activeCount":0,"queueSize":0,"corePoolSize":8,"poolSize":1},"Order":{"activeCount":1,"queueSize":0,"corePoolSize":8,"poolSize":2},"PaymentInformation":{"activeCount":0,"queueSize":0,"corePoolSize":8,"poolSize":2}}}
Scoping commands to a request is often useful for analysis purposes. It allows other request-level data to be associated to Hystrix data and analyzed together. In 1.5.0, a dedicated request stream was added. This is similar in spirit to the idea of inspecting the HystrixRequestLog-produced string at the end of every request, but modeled directly, rather than relying on string parsing.
This stream is produced by com.netflix.hystrix.metrics.HystrixRequestEventsStream. It has a conversion to JSON at com.netflix.hystrix.contrib.requests.stream.HystrixRequestEventsJsonStream and an embedding in an SSE servlet at: com.netflix.hystrix.contrib.requests.stream.HystrixRequestEventsSseServlet.
Here's an example output for the hystrix-examples-webapp :
You can use the hystrix-metrics-event-stream to power the dashboard, real-time alerting, and other such use cases.
You can publish metrics by using an implementation of HystrixMetricsPublisher.
Register your HystrixMetricsPublisher implementations by calling HystrixPlugins.registerMetricsPublisher(HystrixMetricsPublisher impl).
Hystrix includes the following implementations as hystrix-contrib modules:
- Netflix Servo:
hystrix-servo-metrics-publisher - Yammer Metrics:
hystrix-yammer-metrics-publisher
The following sections explain the metrics published with those implementations:
Each HystrixCommand publishes metrics with the following tags:
- Servo Tag:
"instance", Value:HystrixCommandKey.name() - Servo Tag:
"type", Value:"HystrixCommand"
-
Boolean
isCircuitBreakerOpen -
Number
errorPercentage -
Number
executionSemaphorePermitsInUse -
String
commandGroup -
Number
currentTime
Cumulative counts (Counter) represent the number of events since the start of the application.
Rolling counts (Gauge) are configured by metrics.rollingStats.* properties. They are “point in time” counts representing the last x seconds (for example 10 seconds).
| Event | Cumulative Count (Long) | Rolling Count (Number) |
|---|---|---|
BAD_REQUEST |
countBadRequests |
rollingCountBadRequests |
COLLAPSED |
countCollapsedRequests |
rollingCountCollapsedRequests |
EMIT |
countEmit |
rollingCountEmit |
EXCEPTION_THROWN |
countExceptionsThrown |
rollingCountExceptionsThrown |
FAILURE |
countFailure |
rollingCountFailure |
FALLBACK_EMIT |
countFallbackEmit |
rollingCountFallbackEmit |
FALLBACK_FAILURE |
countFallbackFailure |
rollingCountFallbackFailure |
FALLBACK_REJECTION |
countFallbackRejection |
rollingCountFallbackRejection |
FALLBACK_SUCCESS |
countFallbackSuccess |
rollingCountFallbackSuccess |
RESPONSE_FROM_CACHE |
countResponsesFromCache |
rollingCountResponsesFromCache |
SEMAPHORE_REJECTED |
countSemaphoreRejected |
rollingCountSemaphoreRejected |
SHORT_CIRCUITED |
countShortCircuited |
rollingCountShortCircuited |
SUCCESS |
countSuccess |
rollingCountSuccess |
THREAD_POOL_REJECTED |
countThreadPoolRejected |
rollingCountThreadPoolRejected |
TIMEOUT |
countTimeout |
rollingCountTimeout |
Latency Percentiles: HystrixCommand.run() Execution (Gauge)
These metrics represent percentiles of execution times for the HystrixCommand.run() method (on the child thread if using thread isolation).
These are rolling percentiles as configured by metrics.rollingPercentile.* properties.
-
Number
latencyExecute_mean -
Number
latencyExecute_percentile_5 -
Number
latencyExecute_percentile_25 -
Number
latencyExecute_percentile_50 -
Number
latencyExecute_percentile_75 -
Number
latencyExecute_percentile_90 -
Number
latencyExecute_percentile_99 -
Number
latencyExecute_percentile_995
Latency Percentiles: End-to-End Execution (Gauge)
These metrics represent percentiles of execution times for the end-to-end execution of HystrixCommand.execute() or HystrixCommand.queue() until a response is returned (or is ready to return in case of queue()).
The purpose of this compared with the latencyExecute* percentiles is to measure the cost of thread queuing/scheduling/execution, semaphores, circuit breaker logic, and other aspects of overhead (including metrics capture itself).
These are rolling percentiles as configured by metrics.rollingPercentile.* properties.
-
Number
latencyTotal_mean -
Number
latencyTotal_percentile_5 -
Number
latencyTotal_percentile_25 -
Number
latencyTotal_percentile_50 -
Number
latencyTotal_percentile_75 -
Number
latencyTotal_percentile_90 -
Number
latencyTotal_percentile_99 -
Number
latencyTotal_percentile_995
Property Values (Informational)
These informational metrics report the actual property values being used by the HystrixCommand. This enables you to see when a dynamic property takes effect and to confirm a property is set as expected.
-
Number
propertyValue_rollingStatisticalWindowInMilliseconds -
Number
propertyValue_circuitBreakerRequestVolumeThreshold -
Number
propertyValue_circuitBreakerSleepWindowInMilliseconds -
Number
propertyValue_circuitBreakerErrorThresholdPercentage -
Boolean
propertyValue_circuitBreakerForceOpen -
Boolean
propertyValue_circuitBreakerForceClosed -
Number
propertyValue_executionIsolationThreadTimeoutInMilliseconds -
String
propertyValue_executionIsolationStrategy -
Boolean
propertyValue_metricsRollingPercentileEnabled -
Boolean
propertyValue_requestCacheEnabled -
Boolean
propertyValue_requestLogEnabled -
Number
propertyValue_executionIsolationSemaphoreMaxConcurrentRequests -
Number
propertyValue_fallbackIsolationSemaphoreMaxConcurrentRequests
Each HystrixThreadPool publishes metrics with the following tags:
- Servo Tag:
"instance", Value:HystrixThreadPoolKey.name() - Servo Tag:
"type", Value:"HystrixThreadPool"
-
String
name -
Number
currentTime
Rolling Counts (Gauge)
-
Number
rollingMaxActiveThreads -
Number
rollingCountThreadsExecuted
Cumulative Counts (Counter)
-
Long
countThreadsExecuted
ThreadPool State (Gauge)
-
Number
threadActiveCount -
Number
completedTaskCount -
Number
largestPoolSize -
Number
totalTaskCount -
Number
queueSize
Property Values (Informational)
-
Number
propertyValue_corePoolSize -
Number
propertyValue_keepAliveTimeInMinutes -
Number
propertyValue_queueSizeRejectionThreshold -
Number
propertyValue_maxQueueSize