An interface to plot graphs using data from your Google Spreadsheets.
Features:
- Fetch spreadsheet from ID
- Plot 2D graphs using any two columns
- Export graphs in .png
pip install gsheet_plotter-
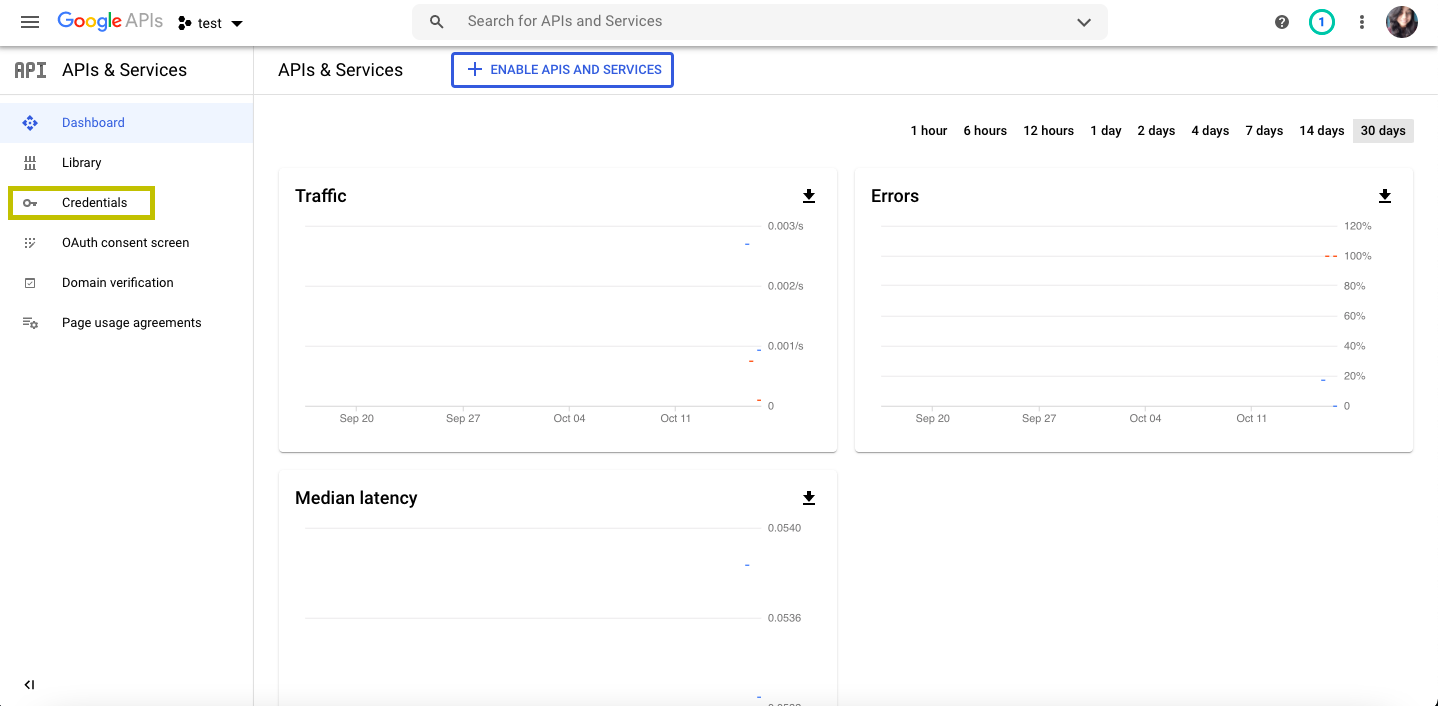
Go to Google-Developer-Console and login with your Google account.
-
In the left pane click on
Credentials
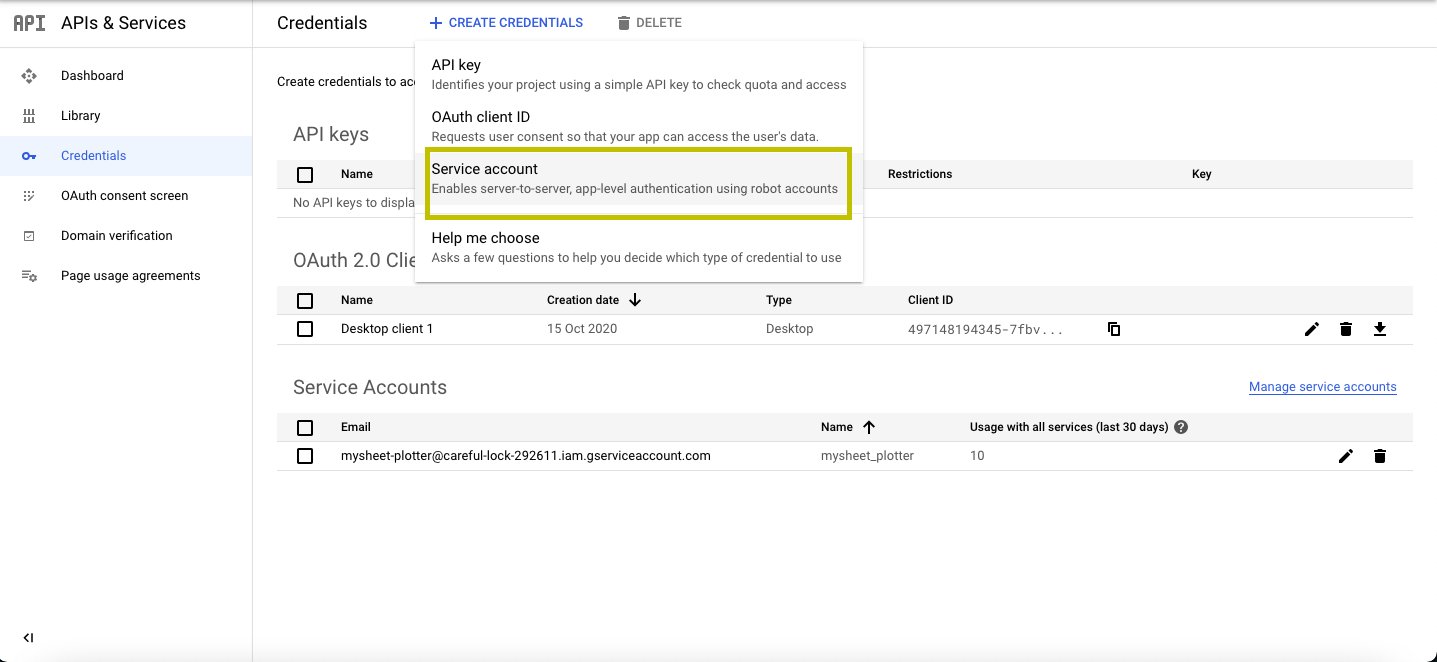
- Click on
Create Credentials
- In the dropdown, choose
Service Account
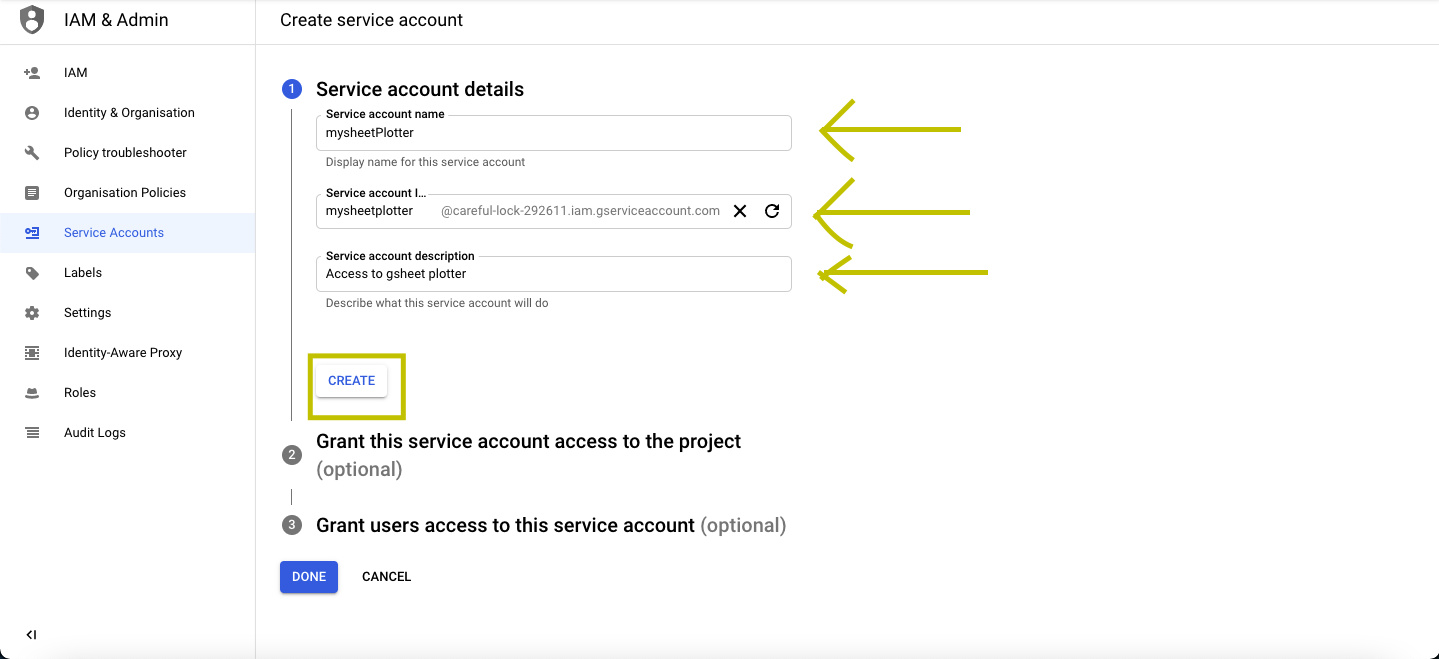
- Fill in the details, and click on
Create
-
Click on
Done -
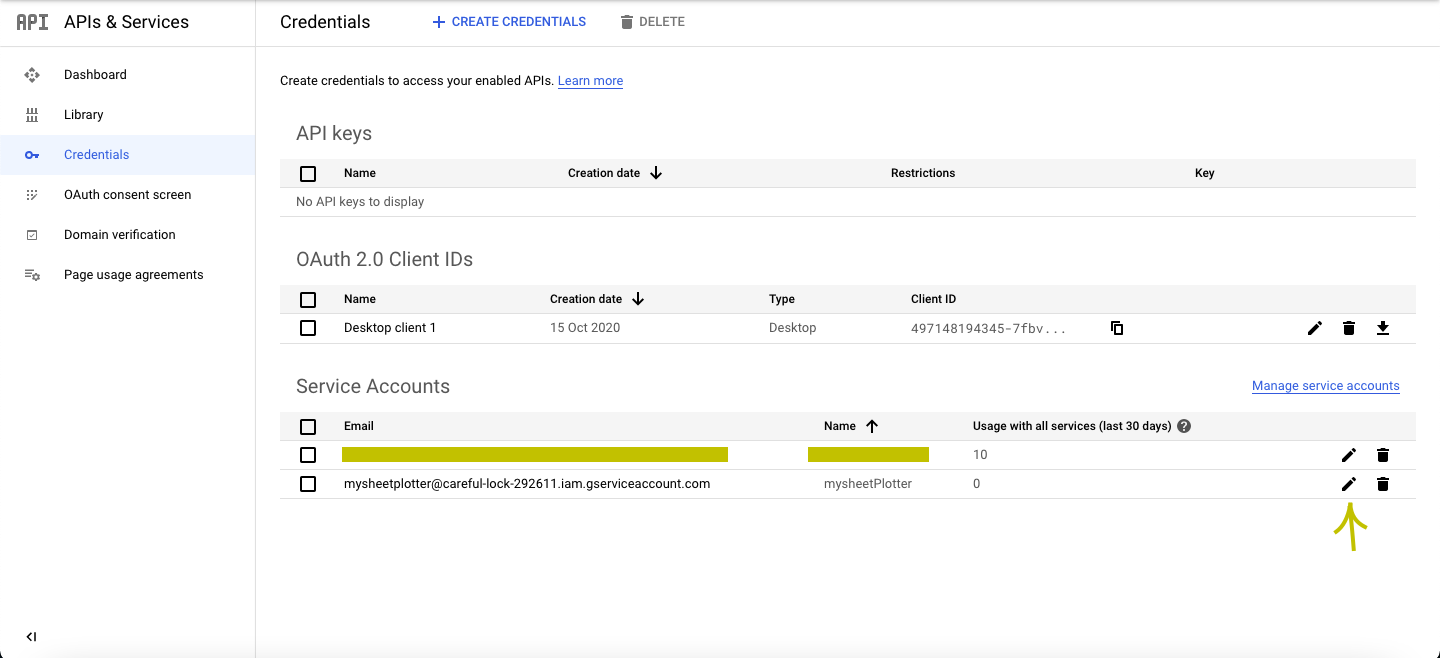
Go back to your dashboard and you'll see new credentials added with the information you entered.
-
Click on the Edit icon
-
Goto Keys on
Add Key. -
Download the JSON file and move to the working directory.
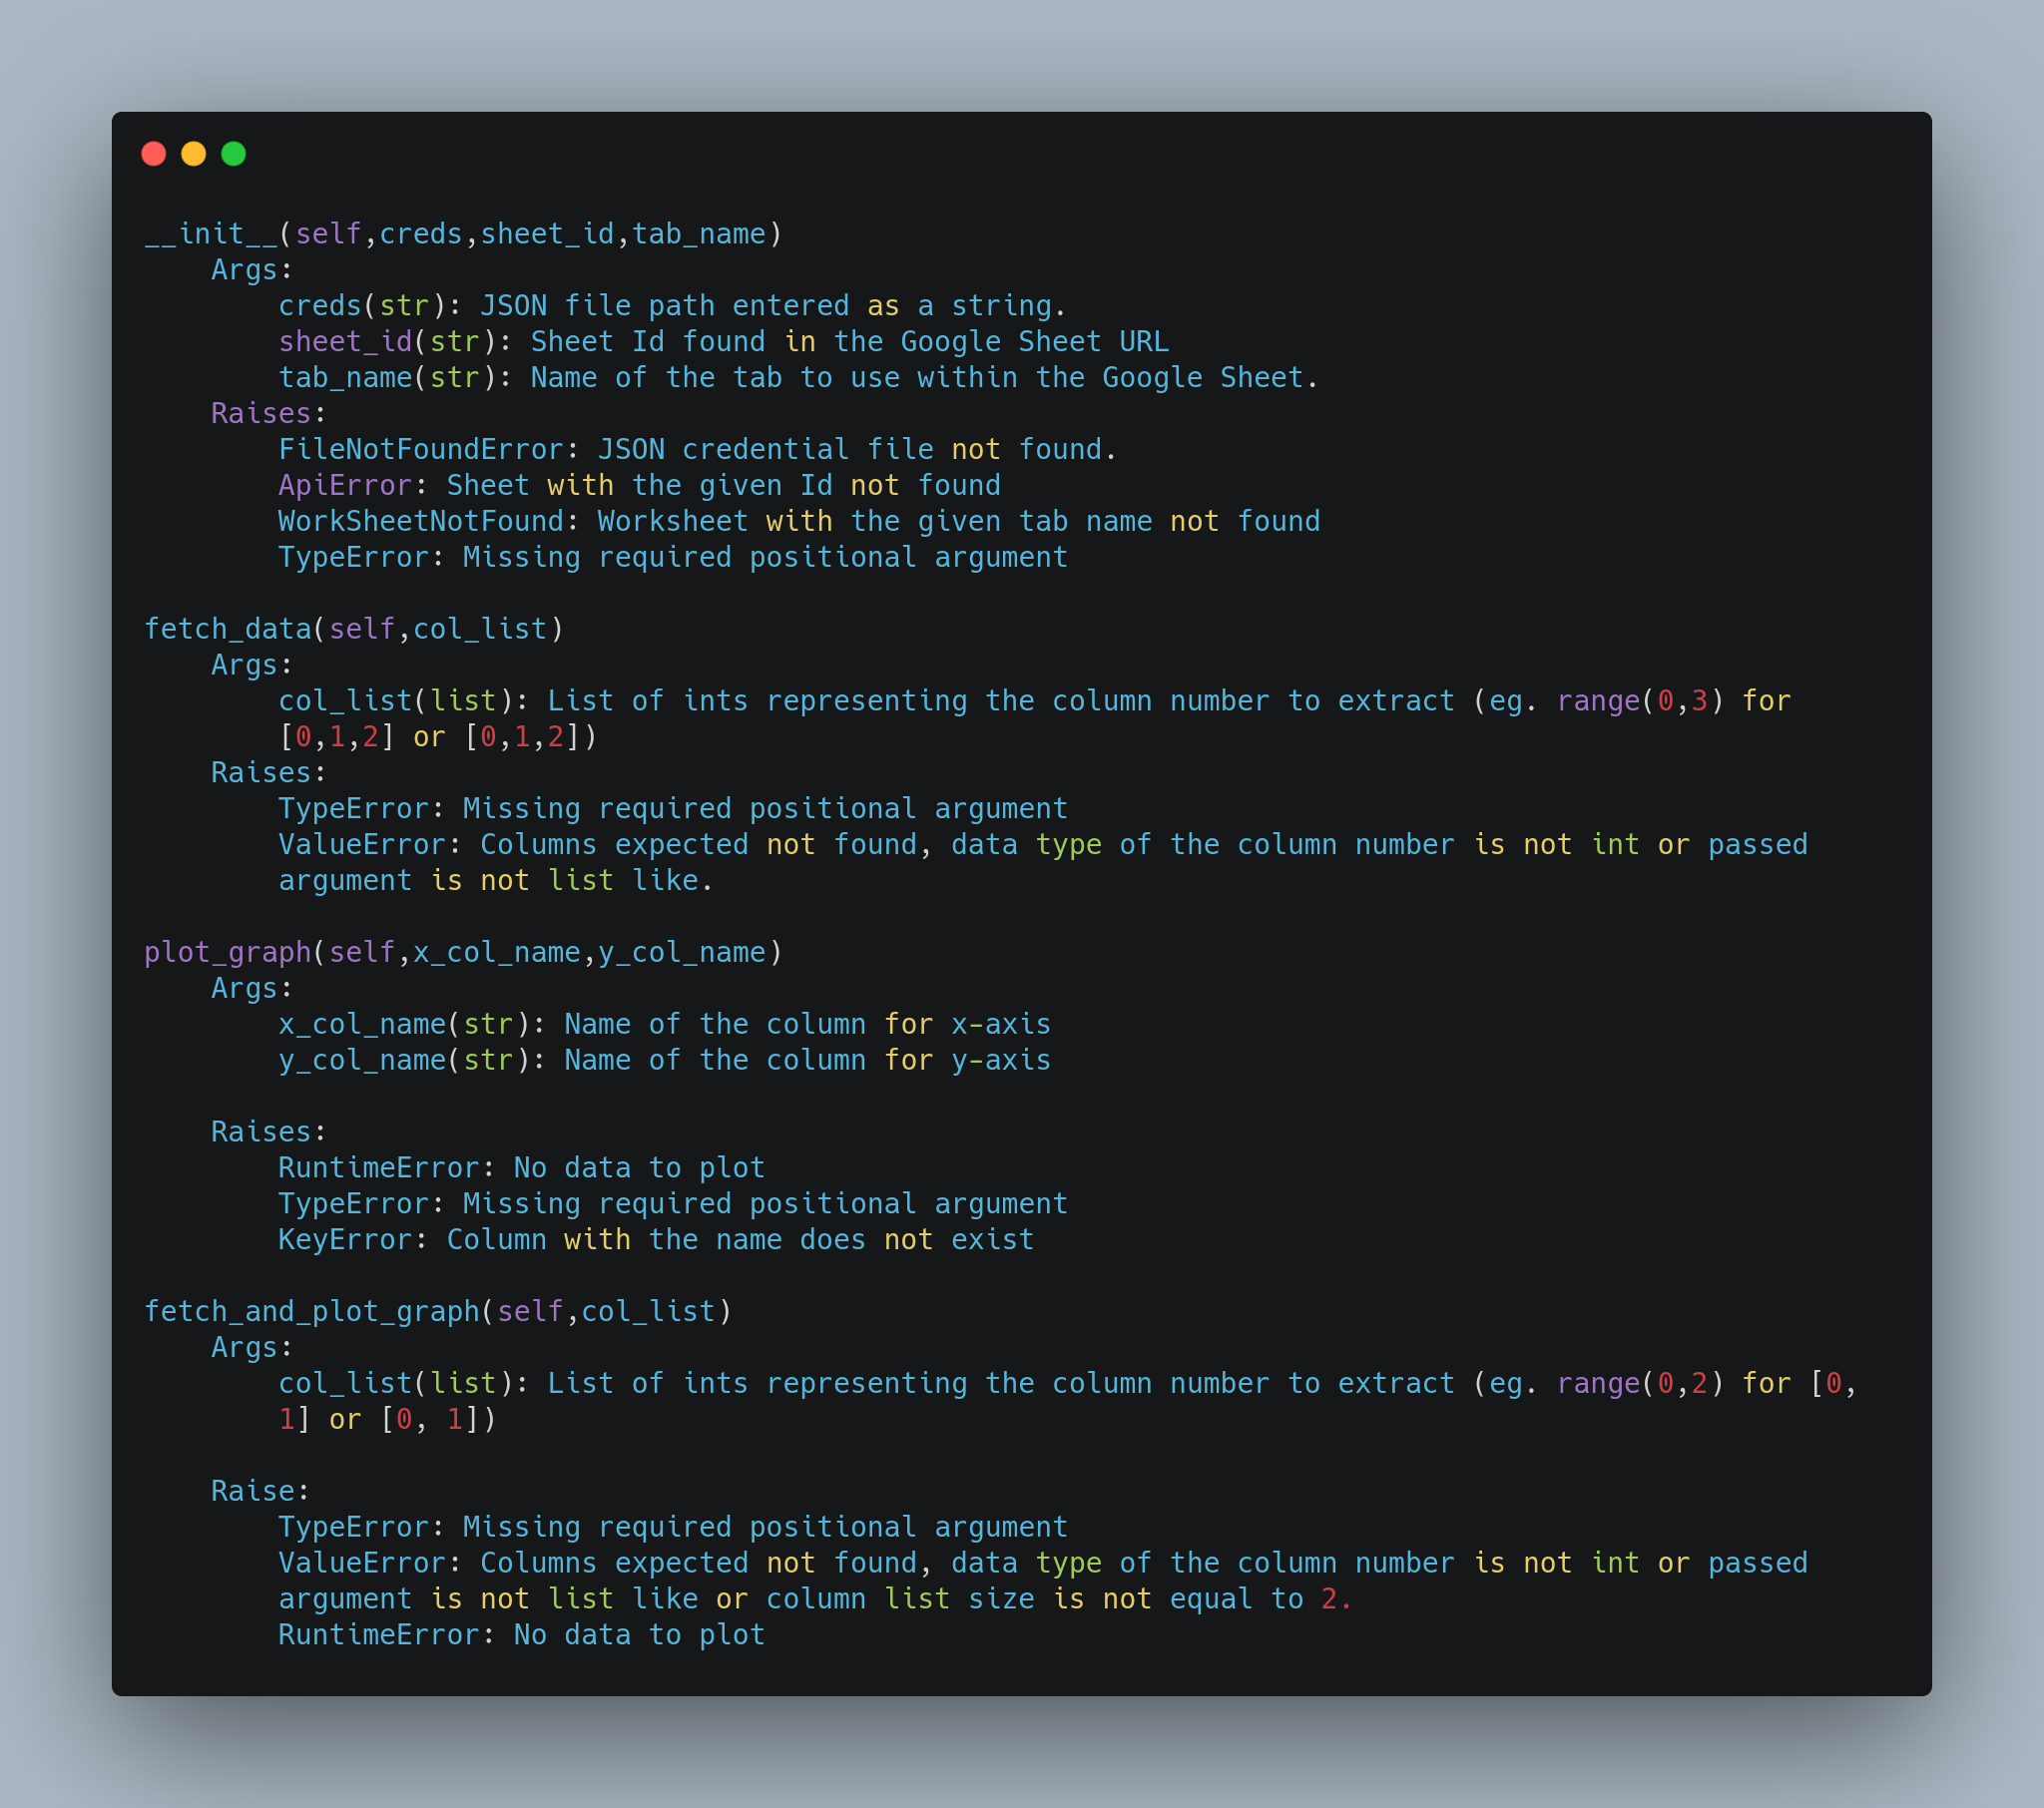
- Instantiate the class by passing Google Service Account json file,Sheet Id found in the Google Sheet URL and the work sheet name
- Fetch data from the sheet to a pandas dataframe. The dataframe is saved in the
dataattribute.
- Plot the graph by using two column names
- Additional method- Fetch the data and plot the graph in one go by passing the column list
