Skip to content
This repository has been archived by the owner on Mar 22, 2024. It is now read-only.

Added FAQs for Experiment Results, and an additional FAQ in Charts #406

Merged
merged 3 commits into from
Oct 5, 2023

Conversation

dpannasch
Copy link
Collaborator

Motivation / Description

Adding FAQs for Experiment Results to address the most common questions that come up. Plus I bundled an additional FAQ for the Subscription Retention Chart at the same time.

Changes introduced

Linear ticket (if any)

Additional comments

@dpannasch dpannasch requested a review from jefago October 3, 2023 13:12
@NachoSoto
Copy link
Contributor

Lint fix: #410

@RCGitBot
Copy link
Contributor

RCGitBot commented Oct 4, 2023

Previews

temp/experiments-results-v1.md

See contents

Within 24 hours of your experiment's launch you'll start seeing data on the Results page. RevenueCat offers experiment results through each step of the subscription journey to give you a comprehensive view of the impact of your test. You can dig into these results in a few different ways, which we'll cover below.

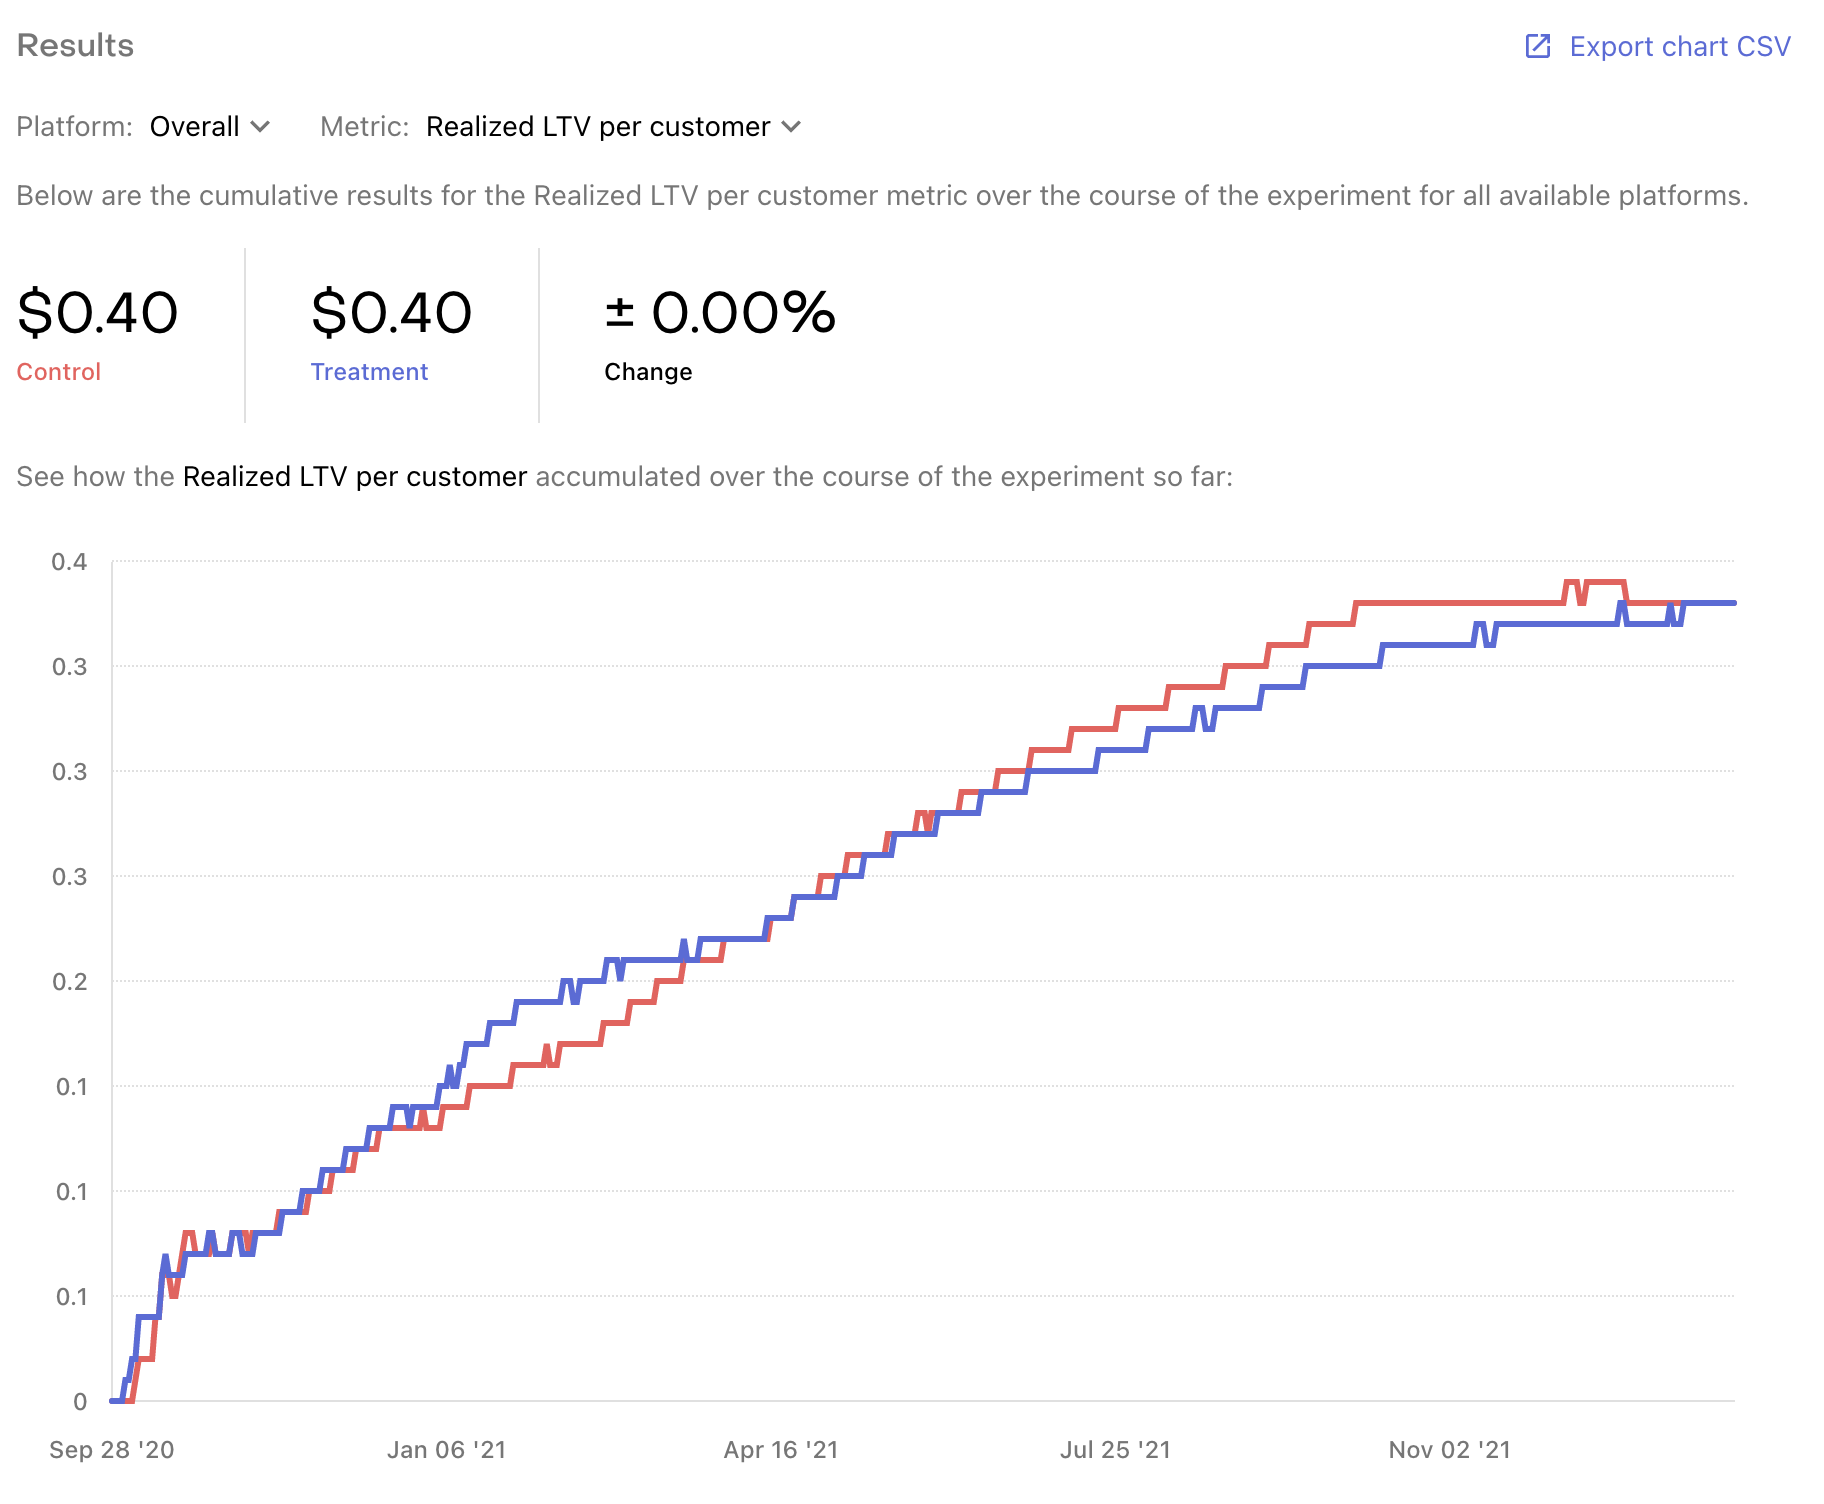
Results chart

The Results chart should be your primary source for understanding how a specific metric has performed for each variant over the lifetime of your experiment.

By default you'll see your *Realized LTV per customer for all platforms plotted daily for the lifetime of your experiment, but you can select any other experiment metric to visualize, or narrow down to a specific platform.
[block:callout]
{
"type": "info",
"title": "Why Realized LTV per customer?",
"body": "Lifetime value (LTV) is the standard success measure you should be using for pricing experiments because it captures the full revenue impact on your business. Realized LTV per customer measures the revenue you've accrued so far divided by the total customers in each variant so you understand which variant is on track to produce higher value for your business.\n\nKeep in mind that your LTV over a longer time horizon might be impacted by the renewal behavior of your customers, the mix of product durations they're on, etc."
}
[/block]
You can also click Export chart CSV to receive an export of all metrics by day for deeper analysis.
[block:callout]
{
"type": "info",
"title": "Data takes 24 hours to appear",
"body": "The results refresher runs once every 24 hours.\n \nIf you're not seeing any data or are seeing unexpected results, try:\n- Ensuring each product that is a part of the experiment has been purchased at least once\n- Waiting another 24 hours until the model can process more data\n\nWhen you stop an experiment, the results will continue to be updated for a full year to capture any additional subscription events, and allow you to see how your Realized LTV matures for each variant over time."
}
[/block]

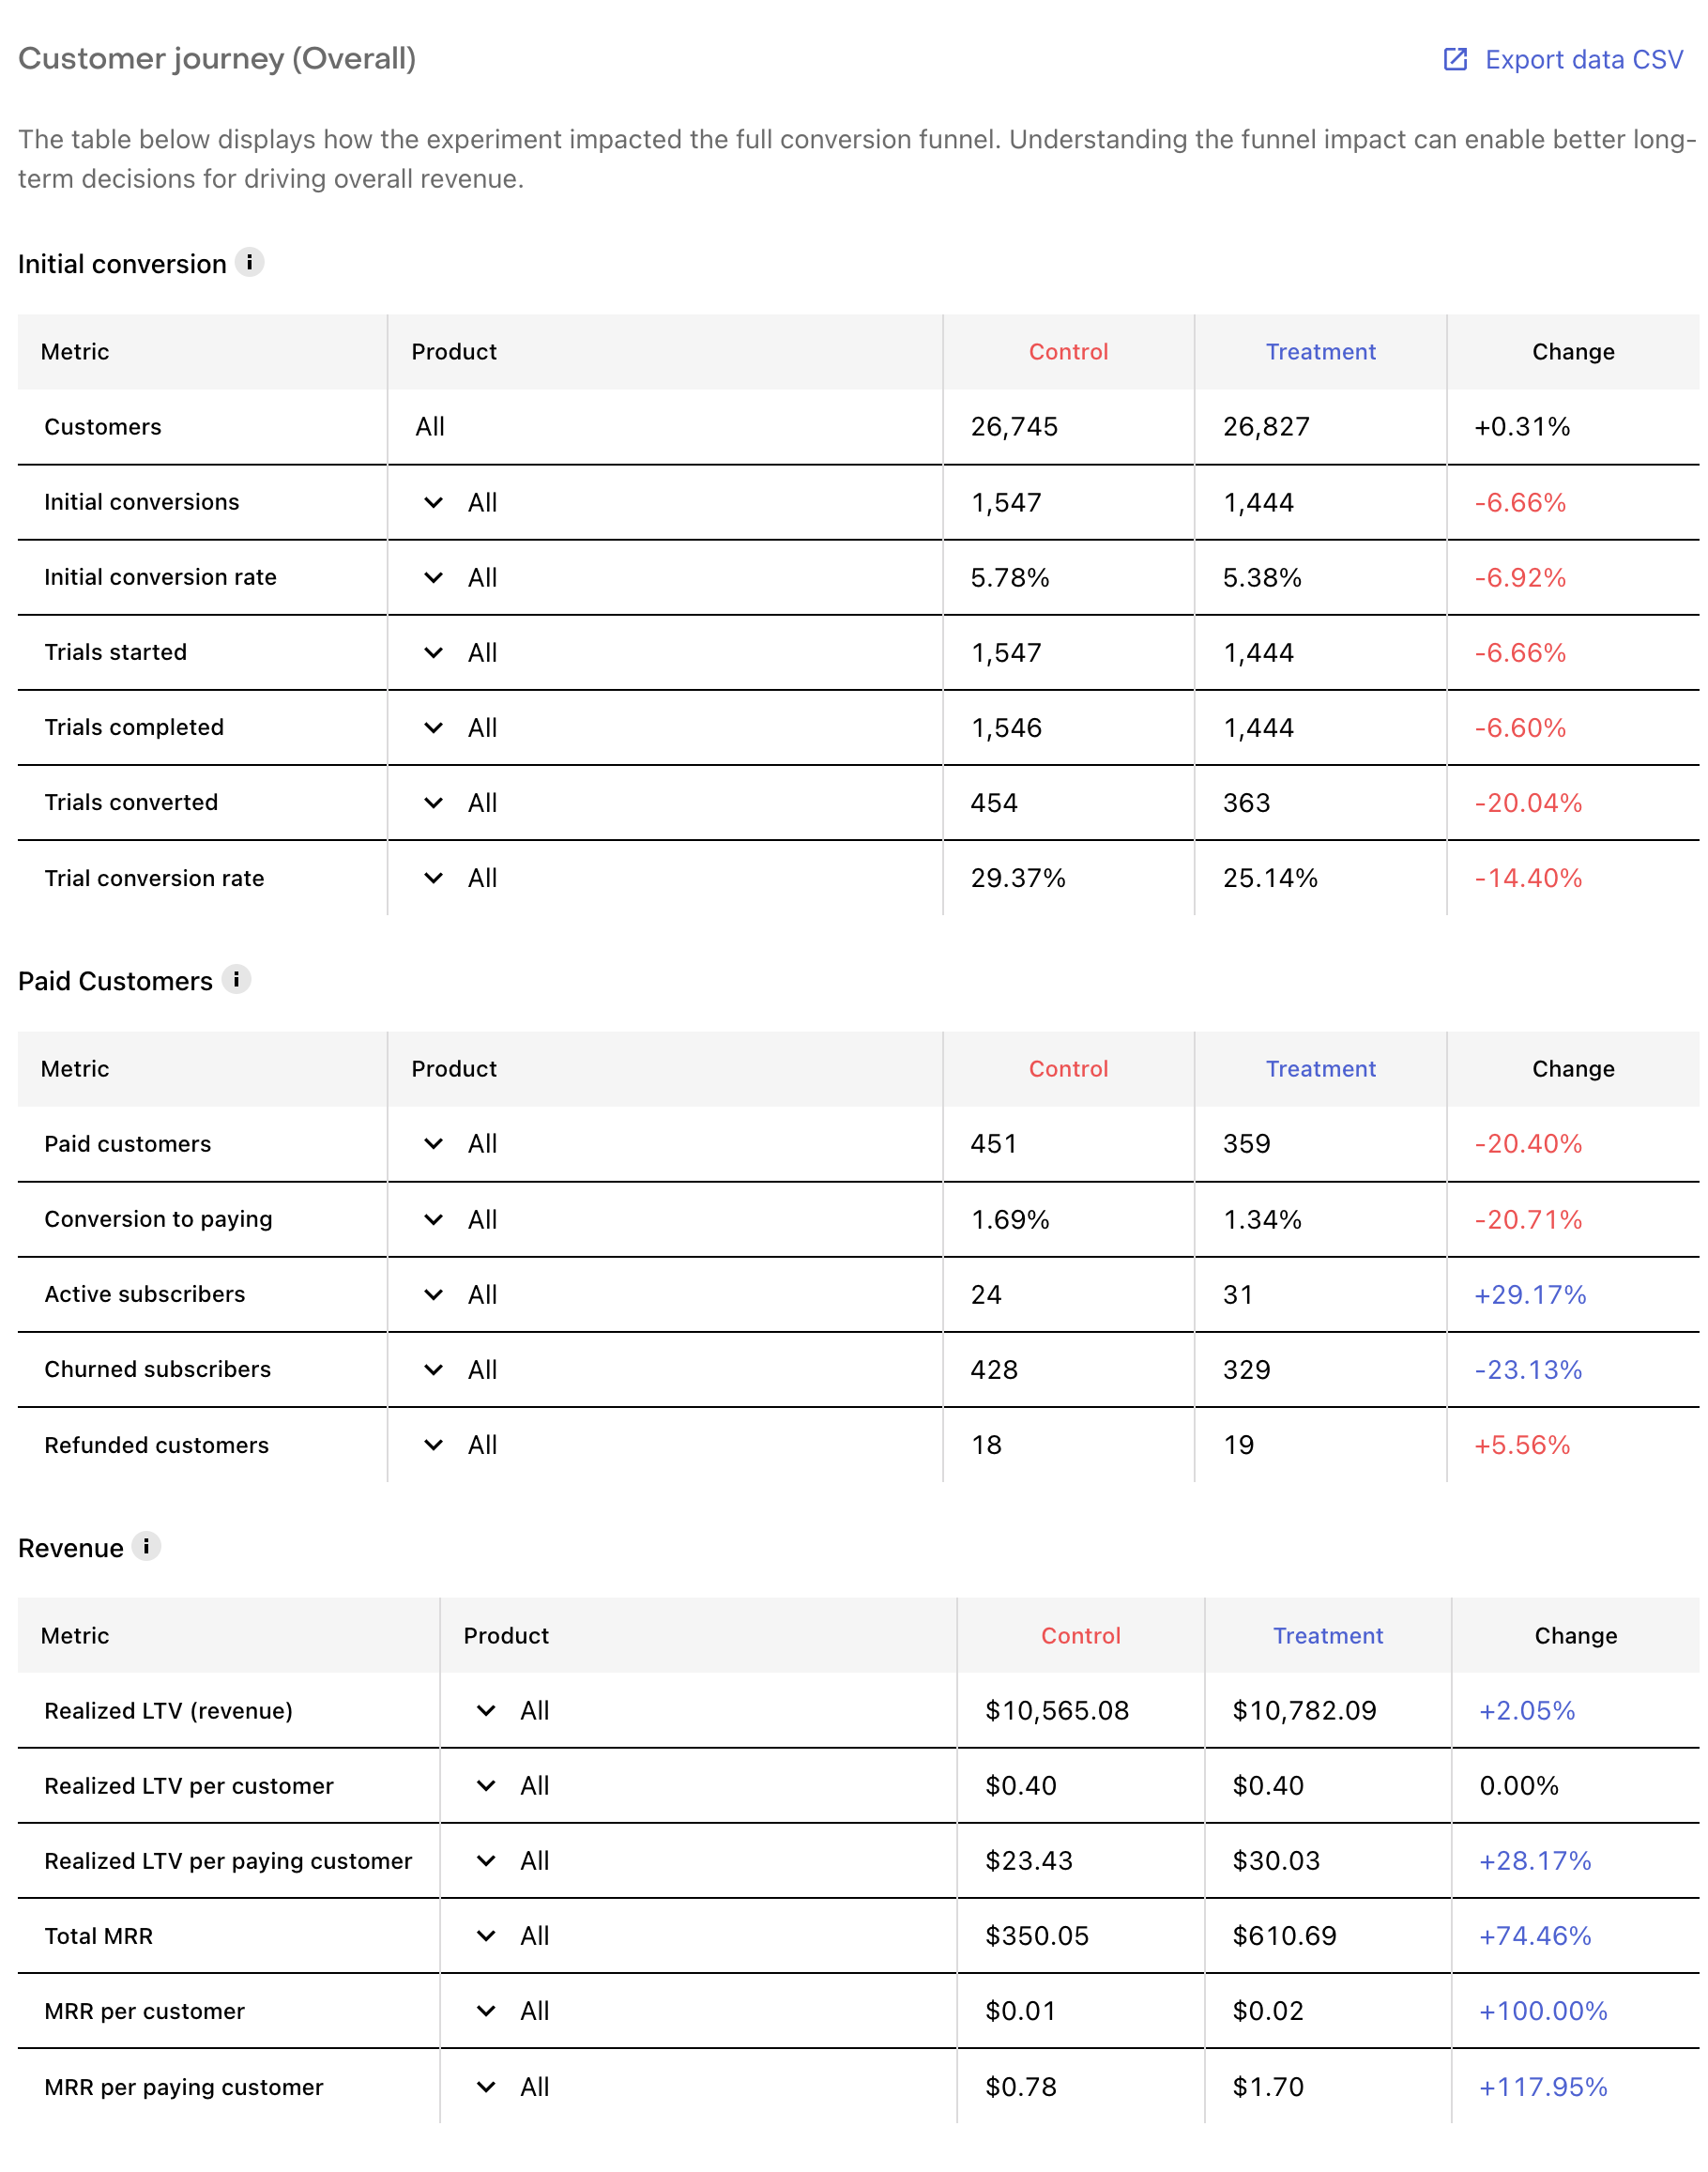
Customer journey tables

The customer journey tables can be used to dig into and compare your results across variants.

The customer journey for a subscription product can be complex: a "conversion" may only be the start of a trial, a single payment is only a portion of the total revenue that subscription may eventually generate, and other events like refunds and cancellations are critical to understanding how a cohort is likely to monetize over time.

To help parse your results, we've broken up experiment results into three tables:

  1. Initial conversion: For understanding how these key early conversion rates have been influenced by your test. These metrics are frequently the strongest predictors of LTV changes in an experiment.
  2. Paid customers: For understanding how your initial conversion trends are translating into new paying customers.
  3. Revenue: For understanding how those two sets of changes interact with each other to yield overall impact to your business.

    In addition to the results per variant that are illustrated above, you can also analyze most metrics by product as well. Click on the caret next to "All" within metrics that offer it to see the metric broken down by the individual products in your experiment. This is especially helpful when trying to understand what's driving changes in performance, and how it might impact LTV. (A more prominent yearly subscription, for example, may decrease initial conversion rate relative to a more prominent monthly option; but those fewer conversions may produce more Realized LTV per paying customer)
    [block:image]
    {
    "images": [
    {
    "image": [
    "https://files.readme.io/2326dd9-Untitled_1.png",
    "Untitled (1).png",
    2419,
    1128,
    "#000000"
    ],
    "caption": ""
    }
    ]
    }
    [/block]
    The results from your experiment can also be exported in this table format using the Export data CSV button. This will included aggregate results per variant, and per product results, for flexible analysis.

🚧 Automatic emails for poor performing tests

If the Realized LTV of your Treatment is performing meaningfully worse than your Control, we'll automatically email you to let you know about it so that you can run your test with confidence.

Metric definitions

Initial conversion metric definitions

[block:parameters]
{
"data": {
"h-0": "Metric",
"h-1": "Definition",
"0-0": "Customers",
"0-1": "All new customers who've been included in each variant of your experiment.",
"1-0": "Initial conversions",
"1-1": "A purchase of any product offered to a customer in your experiment. This includes products with free trials and non-subscription products as well.",
"2-0": "Initial conversion rate",
"2-1": "The percent of customers who purchased any product.",
"3-0": "Trials started",
"3-1": "The number of trials started.",
"4-0": "Trials completed",
"5-0": "Trials converted",
"6-0": "Trial conversion rate",
"4-1": "The number of trials completed. A trial may be completed due to its expiration or its conversion to paid.",
"5-1": "The number of trials that have converted to a paying subscription. Keep in mind that this metric will lag behind your trials started due to the length of your trial. For example, if you're offering a 7-day trial, for the first 6 days of your experiment you will see trials started but none converted yet.",
"6-1": "The percent of your completed trials that converted to paying subscriptions."
},
"cols": 2,
"rows": 7
}
[/block]

Paid customers metric definitions

[block:parameters]
{
"data": {
"h-0": "Metric",
"h-1": "Definition",
"0-0": "Paid customers",
"1-0": "Conversion to paying",
"2-0": "Active subscribers",
"3-0": "Churned subscribers",
"4-0": "Refunded customers",
"0-1": "The number of customers who made at least 1 payment. This includes payments for non-subscription products, but does NOT include free trials.\n\nCustomers who later received a refund will be counted in this metric, but you can use "Refunded customers" to subtract them out.",
"1-1": "The percent of customers who made at least 1 payment.",
"2-1": "The number of customers with an active subscription as of the latest results update.",
"3-1": "The number of customers with a previously active subscription that has since churned as of the latest results update. A subscriber is considered churned once their subscription has expired (which may be at the end of their grace period if one was offered).",
"4-1": "The number of customers who've received at least 1 refund."
},
"cols": 2,
"rows": 5
}
[/block]

Revenue metric definitions

[block:parameters]
{
"data": {
"h-0": "Metric",
"h-1": "Definition",
"0-0": "Realized LTV (revenue)",
"1-0": "Realized LTV per customer",
"2-0": "Realized LTV per paying customer",
"3-0": "Total MRR",
"4-0": "MRR per customer",
"5-0": "MRR per paying customer",
"0-1": "The total revenue you've received (realized) from each experiment variant.",
"1-1": "The total revenue you've received (realized) from each experiment variant, divided by the number of customers in each variant.\n\nThis should frequently be your primary success metric for determining which variant performed best.",
"2-1": "The total revenue you've received (realized) from each experiment variant, divided by the number of paying customers in each variant.\n\nCompare this with "Conversion to paying" to understand if your differences in Realized LTV are coming the payment conversion funnel, or from the revenue generated from paying customers.",
"3-1": "The total monthly recurring revenue your current active subscriptions in each variant would generate on a normalized monthly basis.\n\nLearn more about MRR here.",
"4-1": "The total monthly recurring revenue your current active subscriptions in each variant would generate on a normalized monthly basis, divided by the number of customers in each variant.",
"5-1": "The total monthly recurring revenue your current active subscriptions in each variant would generate on a normalized monthly basis, divided by the number of paying customers in each variant."
},
"cols": 2,
"rows": 6
}
[/block]

[block:callout]
{
"type": "info",
"title": "Only new users are included in the results",
"body": "To keep your A and B cohorts on equal footing, only new users are added to experiments. Here's an example to illustrate what can happen if existing users are added to an experiment: an existing user who is placed in a cohort might make a purchase they wouldn't otherwise make because the variant they were shown had a lower price than the default offering they previously saw. This might mean that the user made a purchase out of fear that they were missing out on a sale and wanted to lock in the price in anticipation of it going back up."
}
[/block]

FAQs

[block:parameters]
{
"data": {
"h-0": "Question",
"h-1": "Answer",
"0-0": "What is included in the "Other" category in the product-level breakdown of my results?",
"0-1": "If the customers enrolled in your experiment purchased any products that were not included in either the Control or Treatment Offering, then they will be listed in the "Other" category when reviewing the product-level breakdown of a metric. \n \nThis is to ensure that all conversions and revenue generated by these customers can be included when measuring the total revenue impact of one variant vs. another, even if that revenue was generated from other areas of the product experience (like a special offer triggered in your app).",
"1-0": "Why do the results for one variant contain purchases of products not included in that variant's Offering?",
"1-1": "There are many potential reasons for this, but the two most common occur when (1) there are areas of your app that serve products outside of the Current Offering returned by RevenueCat, or (2) the offered Subscription Group on the App Store contains additional products outside of that variant's Offering. \n \nFor the first case, please check and confirm that all places where you serve Products in your app are relying on the Current Offering from RevenueCat to determiner what to display. \n \nFor the second case, we recommend creating new Subscription Groups on the App Store for each Offering so that a customer who purchases from that Offering will only have that same set of options to select from one when considering changing or canceling their subscription from Subscription Settings on iOS.",
"2-0": "When I end an Experiment, what Offering will be served to the customers who were enrolled in that Experiment?",
"2-1": "When an Experiment is ended, all customers previously enrolled in it will be served the Current Offering the next time they reach a paywall in your app.",
"3-0": "How can I review the individual transactions that have occurred in my experiment?",
"3-1": "Our Scheduled Data Exports include the experiment enrollment of each subscriber in the reported transactions, and by subscribing to them you can receive daily exports of all of your transactions to analyze the experiment results further."
},
"cols": 2,
"rows": 4,
"align": [
"left",
"left"
]
}
[/block]

temp/subscription-retention-chart.md

See contents

Definition

Subscription Retention shows you how paying subscriptions renew and retain over time by cohorts, which are segmented by subscription start date by default, but can be segmented by other fields like Country or Product as well.

Available settings

  • Filters: Yes
  • Segments: Yes
  • Absolute/Relative Selector: Yes
  • Retention Period Selector: Yes

Segmentation & cohorting

When segmenting by subscription start date, cohorts are segmented by the start of a paid subscription. Subsequent periods along the horizontal table indicate how many subscriptions continued renewing through those periods.

When segmenting by other dimensions, such as Country or Store, cohorts are segmented by the values within that dimension (e.g. App Store or Play Store for the Store segment), and include all paid subscriptions started within the specified date range. Subsequent periods along the horizontal table indicate the portion of subscriptions that successfully renewed out of all those that had the opportunity to renew in a given period.

How to use Subscription Retention in your business

Measuring Subscription Retention is crucial for understanding:

  1. How your product is delivering value over time
  2. How your Realized LTV is likely to change over time, and
  3. What subscriber segments exhibit the strongest and weakest retention

By studying this data, you may learn which customer segments are worth focusing your product and marketing efforts on more fully, or where you have the opportunity to improve your pricing to increase retention over time.

Calculation

For each period, we measure:

Subscriptions: The count of new paid subscriptions started within that period.

  • This differs from other charts that are cohorted by a customer’s first seen date. This chart is cohorted by first purchase date.

Retention through each available period

  • Retention: The number of subscriptions in the cohort who made an additional payment in a given period that have had the opportunity to do so.
  • Available period: Use the date range selector to determine the range of subscribers to include in the chart. For each cohort included in that date range, all available retention periods will be provided.

📘 Segmenting by other dimensions

When segmenting by subscription start date, each subscriber in that cohort will have had an equal opportunity to renew within a given period, but when segmenting by other dimensions, each subscriber may have different subscription start dates, and therefore different renewal opportunities.

As a result, the retention rate within each period cannot be directly compared to the total size of the cohort, because we will only measure the retention rate of the portion of that cohort that had the opportunity to renew in that period (e.g. for Month 3 retention, we will only include subscribers whose subscription start date is at least 3 months ago).

Formula

When segmenting by Subscription Start Date
[Retained Subscriptions at x period] / [Subscriptions] = Retention

When segmenting by other dimensions
[Retained Subscriptions at x period] / [Subscriptions that have had the opportunity to renew] = Retention

📘

Retention is always calculated relative to the size of the initial cohort that has had the opportunity to renew. Retention is not calculated relative to the prior period.

FAQs

[block:parameters]
{
"data": {
"h-0": "Question",
"h-1": "Answer",
"0-0": "How are resubscribes handled in Subscription Retention?",
"0-1": "If a user churns, but later resubscribes, they will be counted as a retained subscription in the original purchase period.",
"1-0": "How are refunds handled in Subscription Retention?",
"1-1": "Refunded subscriptions are treated like subscriptions that churned during the period that the refund occurred in.",
"2-0": "How are product changes handled in Subscription Retention?",
"2-1": "This chart measures retention on a per-product basis. \n \nIf a subscriber changes products, they would be counted as “churned” on the old product and start a new “retention journey” on the new one. Their new cohort would be based on the date the transaction for the new product was completed.",
"3-0": "Can I measure Subscription Retention across all product durations?",
"3-1": "Subscription Retention is filtered by product duration based on the selected Retention Period, and does not support measuring retention across all product durations today. \n \nThis is to ensure that the selected Retention Period (e.g. Yearly) maps to the available retention points in a subscriber’s lifecycle. \n \nFor example, a monthly subscriber who retained for only 10 months would not be counted as a retained subscriber at 1 year, but has a vastly superior retention rate (and therefore lifetime value) when compared to the subscriber who retained for 2 months, and only the Monthly Retention Period would show that contrast. \n \nWe’ll continue improving this chart to allow for more flexible retention measurements in the future.",
"4-0": "How are incomplete periods displayed in Subscription Retention?",
"4-1": "The final, incomplete period of a given cohort is indicated with a hashed background. \n \nIt shows how many subscriptions are set to renew by the end of the period, taking into account the auto-renewal preference of the subscriptions.",
"5-0": "How are introductory offers treated in this chart?",
"5-1": "Introductory offers are not included in the Subscription Retention chart. A subscription's first purchase date is treated as the date of its first payment of the standard subscription period. This differs from other charts which include introductory offers in the definition of "paid" subscribers because our methodology for measuring retention requires that all transactions in a given subscription are of a single duration."
},
"cols": 2,
"rows": 6,
"align": [
"left",
"left"
]
}
[/block]

Copy link
Contributor

@jefago jefago left a comment

Choose a reason for hiding this comment

The reason will be displayed to describe this comment to others. Learn more.

LGTM!
@dpannasch dpannasch merged commit a2f7a49 into main Oct 5, 2023
9 checks passed
@dpannasch dpannasch deleted the dp-misc-cia-docs-updates branch October 5, 2023 13:19
Sign up for free to subscribe to this conversation on GitHub. Already have an account? Sign in.
Labels
None yet
Projects
None yet
Development

Successfully merging this pull request may close these issues.

4 participants