![]()
AcuteBenchmark allows you to benchmark functions that get Arrays as their input.
It is used inside IntelVectorMath for benchmarking its functions. A fully working example available here: https://github.com/JuliaMath/VML.jl/blob/AcuteBenchmark/benchmark/benchmark.jl
Creates random inputs for a function based on limits, types, and dims specified.
config = Funb(
    fun = sin,
    limits = [(-1,1)],
    types = [Float32, Float64],
    dims = [10 100 200],
)
or just in a compact form:
config = Funb( sin, [(-1,1)], [Float32, Float64], [10 100 200])- fun: the function
:funor :(Module.fun) - limits: min and max of possible values
- types : type of elements
- dims:
- each element gives the size of the input, and it is a:
- Number (for 1D)
- Tuple (for N-D)
- each row for each function argument
- each column for each dimension set.
- each element gives the size of the input, and it is a:
use benchmark! to run the benchmark:
using AcuteBenchmark

configs = FunbArray([
    Funb( sin, [(-1,1)],[Float32, Float64], [10] );
    Funb( atan, [(-1,1), (-1,1)],[Float32, Float64],[10; 10] );
    Funb( *, [(-1, 1), (-1, 1), (-1, 1)], [Float32, Float64], [(10,10); (10,10)] );
    ])

benchmark!(configs)
Plot the benchmark result using:
bar(configs)
To have a same color for the same types use:
bar(configs, uniqueType = true, dimAnnotation = true)
To plot the relative speed, pass a pair of configs:
bar(configsRealBase => configsRealIVM, uniqueType = true, dimAnnotation = false, uniqueDim = true, "Base" => "IntelVectorMath")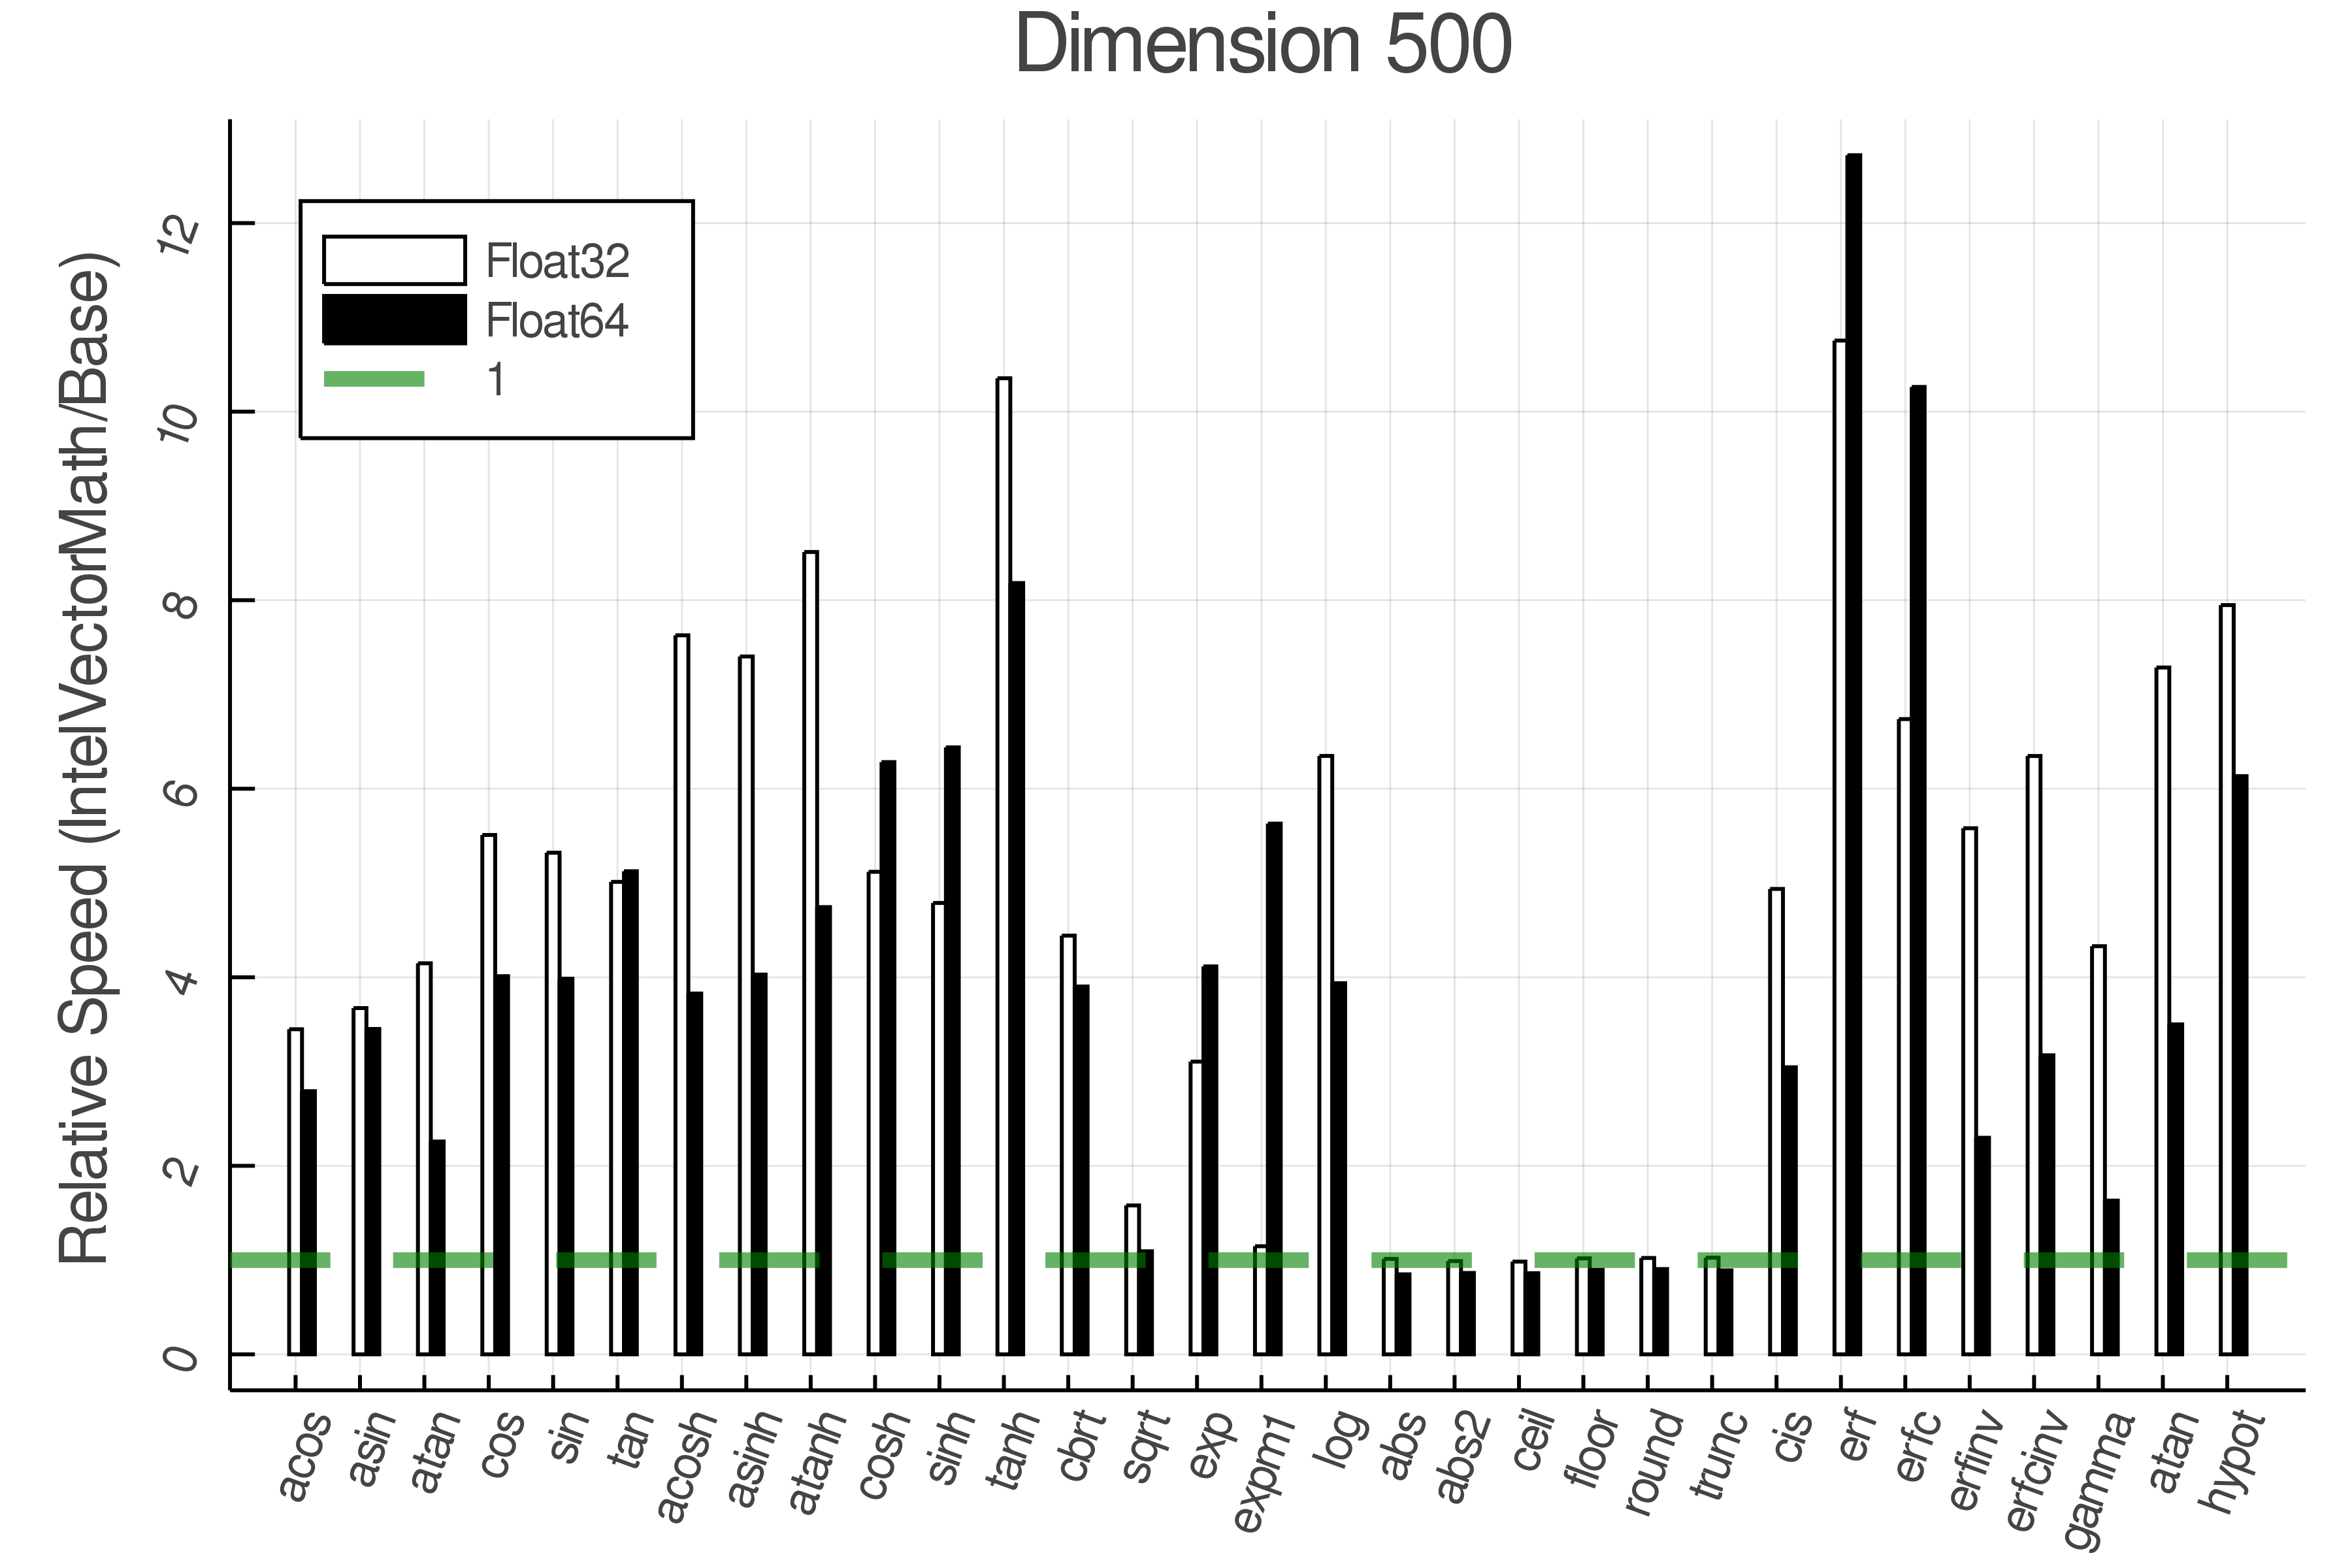
To plot how the function acts over different dimension sets:
configs2 = Funb( sin, [(-1,1)],[Float32, Float64], [10 30 50 100 200 500] );
benchmark!(configs2)
dimplot(configs2)
The axes are logarithmic.

To compare different sets pass an array of configs:
dimplot([configsRealBase,configsRealIVM],["Base", "IntelVectorMath"])Use AcuteBenchmark.save and AcuteBenchmark.load to read and write the benchmark data.
AcuteBenchmark.save("test.jld2", configs)
configs_loaded = AcuteBenchmark.load("test.jld2")