Just clone the repository in the Grafana plugins folder
git clone git@github.com:ovh/ovh-warp10-datasource.git /var/lib/grafana/plugins/ovh-warp10-datasourceGrafana will use the dist/ folder by default
- go to the Grafana menu (top left) > "datasources" > "add data source"
- choose a name
- set Warp10 as type
- paste the Warp10 platform URL ( do not append /api/v0/... )
You can define variables at datasource level (~ organisation level) which can be available for all dashboards. you can put tokens, constants, macros, ... In case of a macro definition, the variable value must start with <% and end with %>. In the query you can prepend @ to the macro name to execute it.
On a new dashboard, in a graph edition, choose your previous datasource and click add query.
You can write your WarpScript on the editor below, for beginners, you can uncheck warpScript editor, a user friendly query editor will appear.
A query is composed by 2 component, the WarpScript from WarpScript editor and the WarpScript from friendly query builder, check or uncheck the WarpScript editor will execute the corresponding WarpScript.
to graph something on Grafana you need to return some GTS
/!\ The plugin look for GTS or GTS array in your stack, all other stack entry will be ignored
NEWGTS
'io.warp10.grafana.test' RENAME @myMacro
'func' 'sinus' 2 ->MAP RELABEL
'sinus' STORE

NEWGTS
'io.warp10.grafana.testmetric' RENAME
'func' 'cosinus' 2 ->MAP RELABEL
'cosinus' STORE

100 // Not graphable -> ignored
'b' // Not graphable -> ignored

$interval 20 / TOLONG 'step' STORE

<% $step + %> 'stepMacro' STORE
<% 'index' STORE $sinus $index NaN NaN NaN $index SIN  ADDVALUE DROP %> 'execMacroSinus' STORE
<% 'index' STORE $cosinus $index NaN NaN NaN $index COS  ADDVALUE DROP %> 'execMacroCoinus' STORE

$start $end $stepMacro $execMacroSinus FORSTEP
$start $end $stepMacro $execMacroCoinus FORSTEP
$sinus $cosinus
There is a way to build custom tables instead of formating GTS array
If your stack have only 1 element and this element have columns and rows property
Then you can choose Table as Table transform in Table Options section
WarpScript example:
{
  'columns' [
    {
      'text' 'columnA'
      'type' 'number'
      'sort' true
      'desc' true
    }
    {
      'text' 'columnB'
      'type' 'number'
    }
  ]
  'rows' [
    [ 10 20 ]
    [ 100 200 ]
  ]
}
You can use ovh-warp10-datasource as datasource for showing position data on grafana using grafana-worldmap-panel plugin.
In order to do it, you need to install the grafana-worldmap-panel plugin: Worldmap Panel.
When both ovh-warp10-datasource and the grafana-worldmap-panel installed, you can define a new Worldmap widget,
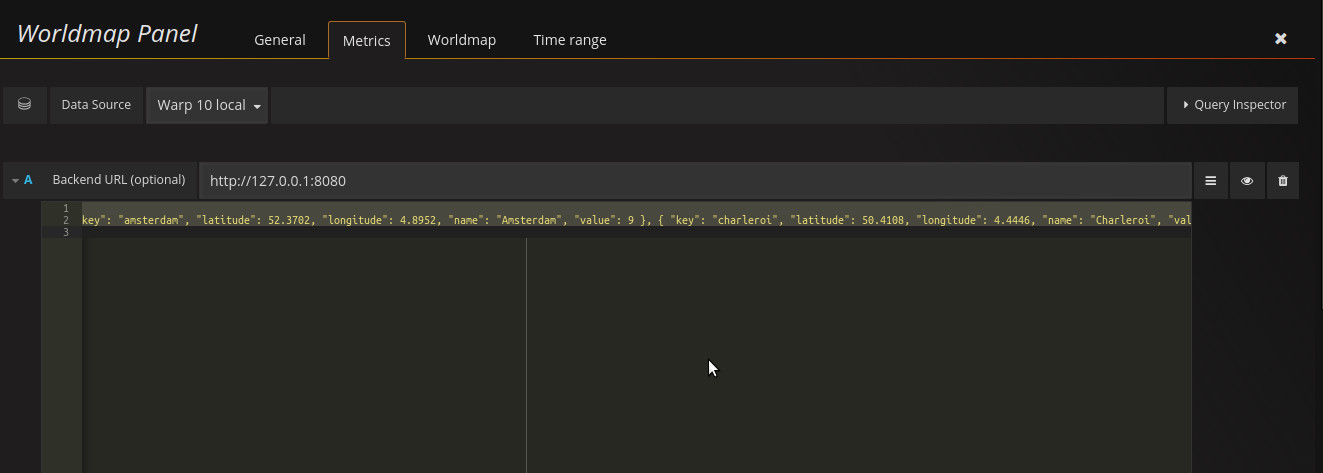
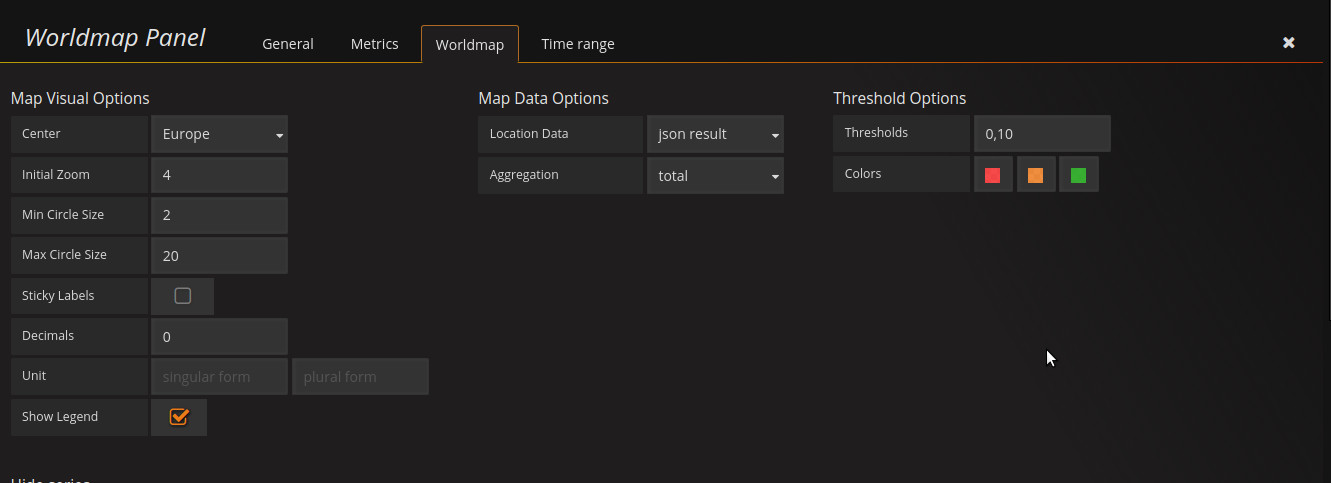
with a Warp 10 datasource and json result as Location Data in the Worlmap tab:
Now in your WarpScript you can generate data in the JSON format supported by Worldmap, for example :
'[ { "key": "amsterdam", "latitude": 52.3702, "longitude": 4.8952, "name": "Amsterdam" }, { "key": "charleroi", "latitude": 50.4108, "longitude": 4.4446, "name": "Charleroi" }, { "key": "frankfurt", "latitude": 50.110924, "longitude": 8.682127, "name": "Frankfurt" }, { "key": "london", "latitude": 51.503399, "longitude": -0.119519, "name": "London" }, { "key": "paris", "latitude": 48.864716, "longitude": 2.349014, "name": "Paris" } ]'
JSON->
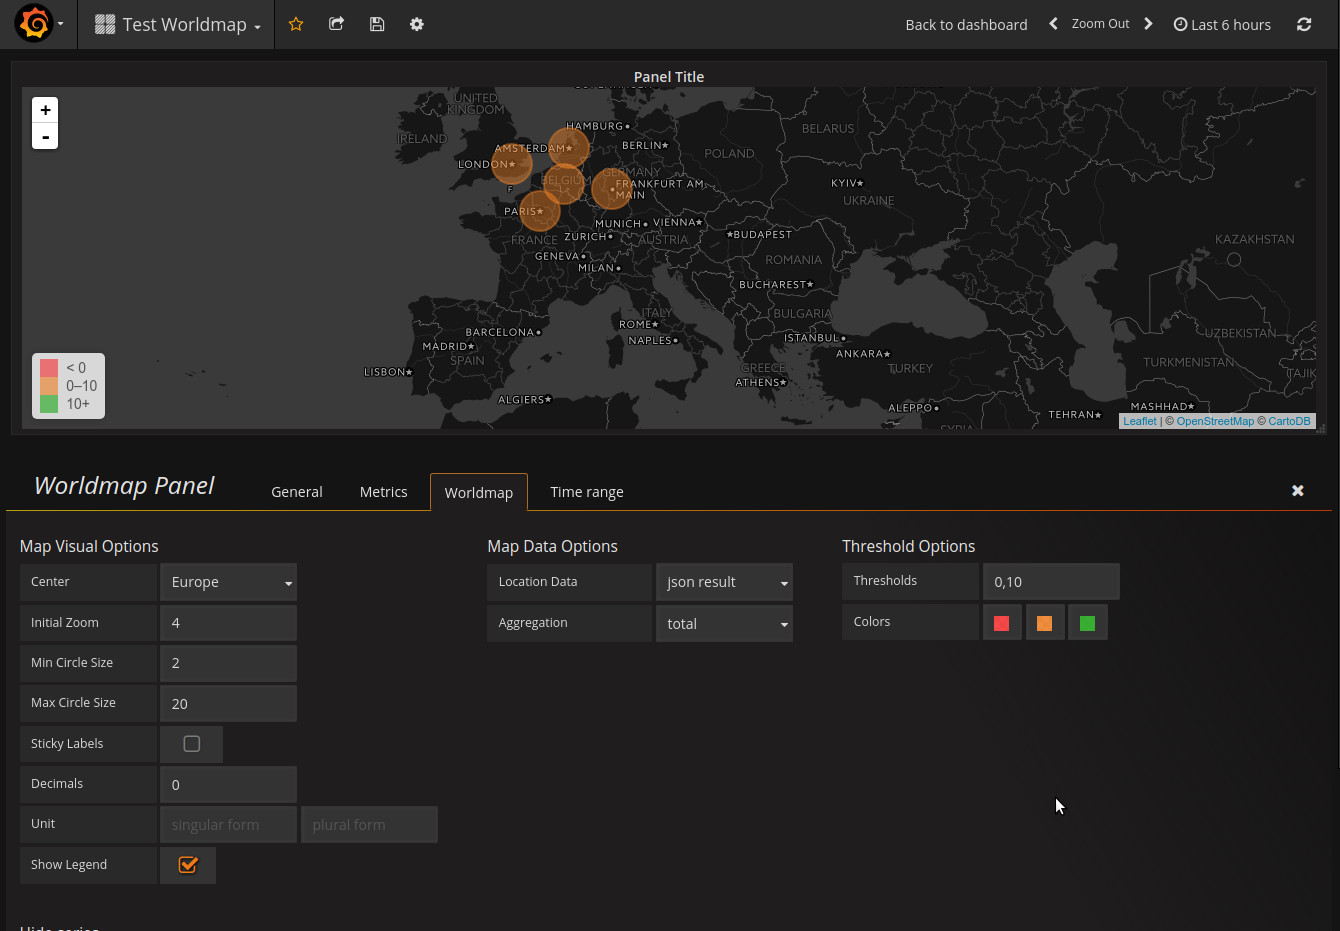
And then you can see the chosen locations in the map:
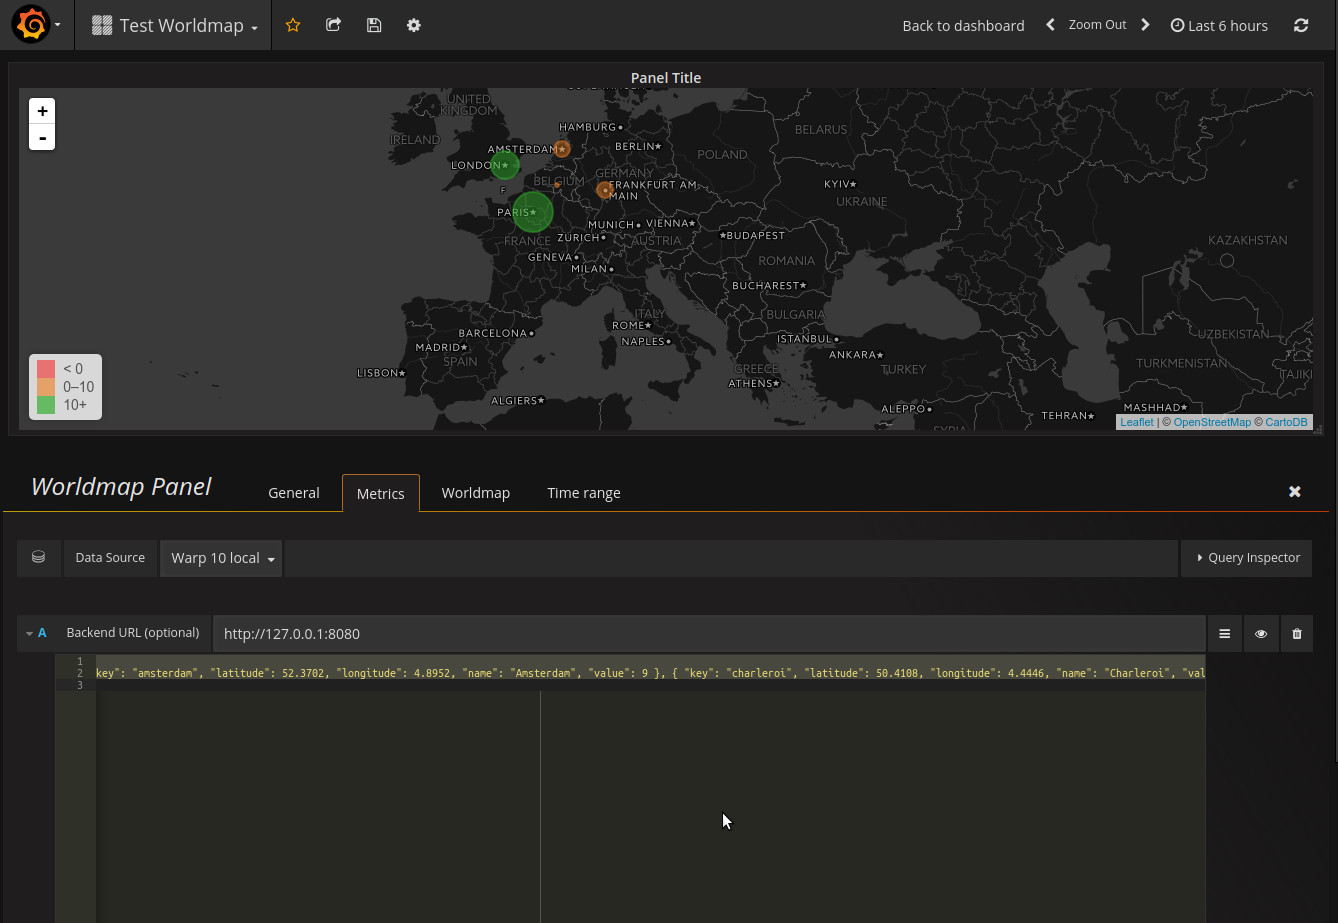
You can also give a value to each location, in order to show the locations with different sizes and colors, as Worldmap allows:
'[ { "key": "amsterdam", "latitude": 52.3702, "longitude": 4.8952, "name": "Amsterdam", "value": 9 }, { "key": "charleroi", "latitude": 50.4108, "longitude": 4.4446, "name": "Charleroi", "value": 6 }, { "key": "frankfurt", "latitude": 50.110924, "longitude": 8.682127, "name": "Frankfurt", "value": 9 }, { "key": "london", "latitude": 51.503399, "longitude": -0.119519, "name": "London", "value": 12 }, { "key": "paris", "latitude": 48.864716, "longitude": 2.349014, "name": "Paris", "value": 15 } ]'
JSON->
On your WarpScript you can use (all timestamps are in µSeconds):
| Name | Description | Example |
|---|---|---|
| $end | Timestamp of the most recent point in the Grafana time window | 1498038153276000 |
| $endISO | end value in ISO-8601 format | '2017-06-21T09:42:33.276Z' |
| $start | Timestamp of the less recent point in the Grafana time window | 1498034553276000 |
| $startISO | start value in ISO-8601 format | '2017-06-21T08:42:33.276Z' |
| $interval | Difference between $end and $start | 3600000000 |
You can add Annotation on your graph: Dashboard > "Manage dashboard" > "Annotations" Just add you WarpScript
/!\ You must return a single GTS on TOP of your stack
NEWGTS
'alerts' RENAME
{ 'a' 'b' 'c' 'd' } RELABEL
$end $interval 2 / - NaN DUP DUP 'Restart WebServer' ADDVALUE
$end $interval 3 / - NaN DUP DUP 'Update v1.0.2' ADDVALUE
To understand the variable resolution, this is how a query is built
- Inject dashboard variables ($end, $interval, etc...)
- Inject datasource variables
- Inject templating variables resoled in the configuration order (a templating variable can call the previous templating variables in its resolution)
- Inject user query (can use all previous variables)
/!\ all of the templating values are casted into strings by Grafana engine.
- Basic Fetch
- Bucketizer
- Reducer
- Renamer
- Mapper
- Filter
- Extend limits (LIMIT, MAXOPS, MAXFETCH, ...)
- Anomaly detection
100 'datapointsCount' STORE
[ $READ_TOKEN '~.*' {} $end $interval ] FETCH
[ SWAP bucketiser.max $end $interval $datapointsCount/ datapointsCount ] BUCKETIZE


