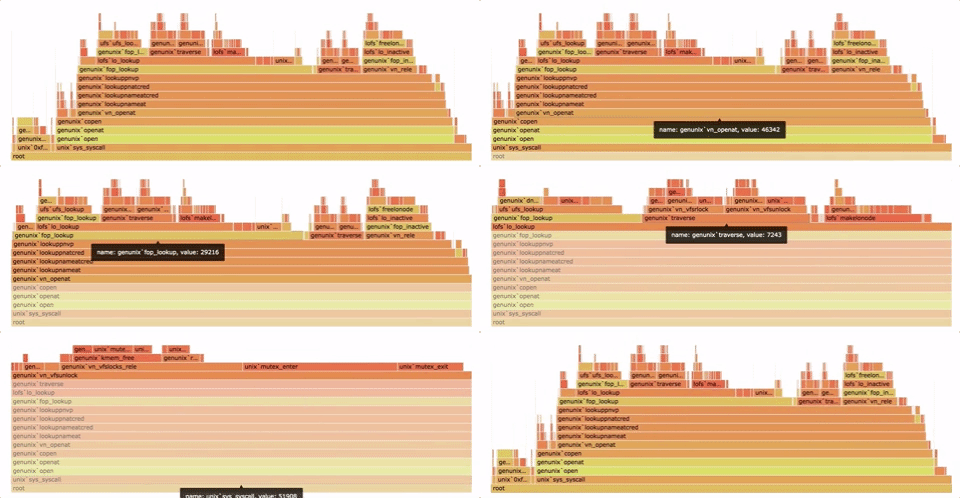
Please read Brendan Gregg's post
Grafana live demo [deprecated]
Look for the demo folder in the Github repo to correctly run it with docker-compose
To generate metrics on the "demo" service (docker samber/node-promfiler-demo), a cronjob executes requests on API regulary.
You will see some pow() calls in the graph.
Prometheus exporter: Promfiler
$ npm install -g promfiler
$ promfiler app.js
This Grafana panel is based on the great library d3-flamegraph, wrote by Spiermar.
