Cloud Native development with Thorntail and Microprofile
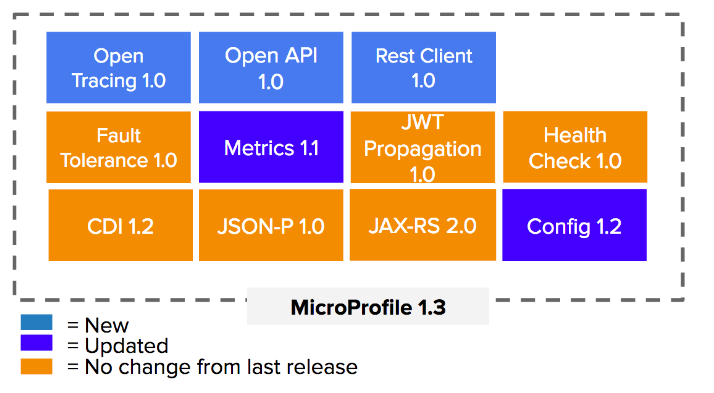
- Thorntail (Former WildFly swarm)
- Payara server
- Wildfly 14 (limited to MP Health, MP Config, MP OpenTracing)
- TomEE
- Websphere Liberty
- KumuluzEE
- Throntail Application: http://localhost:8180/resource/info
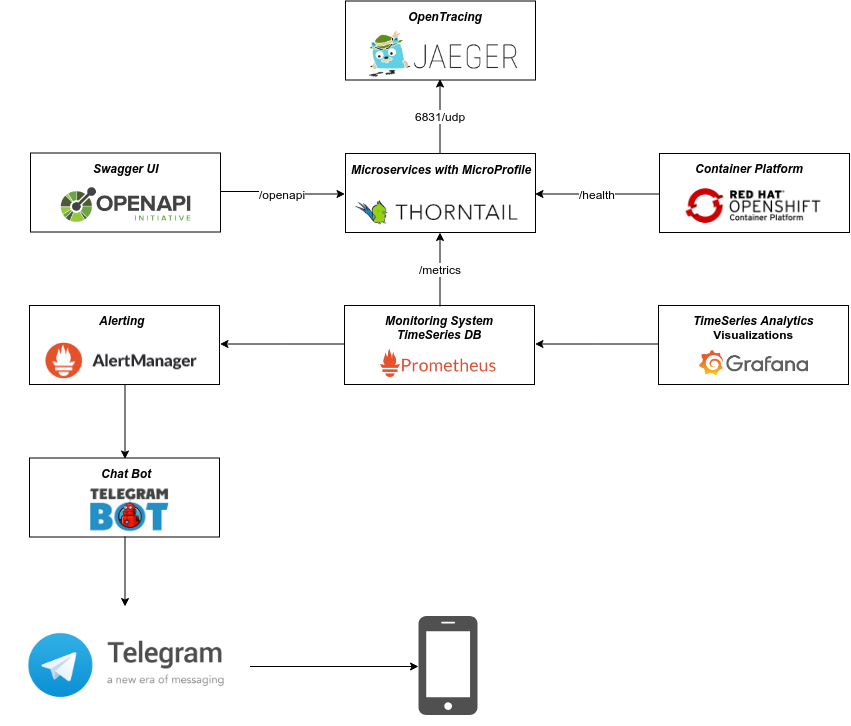
- Prometheus: http://localhost:9090
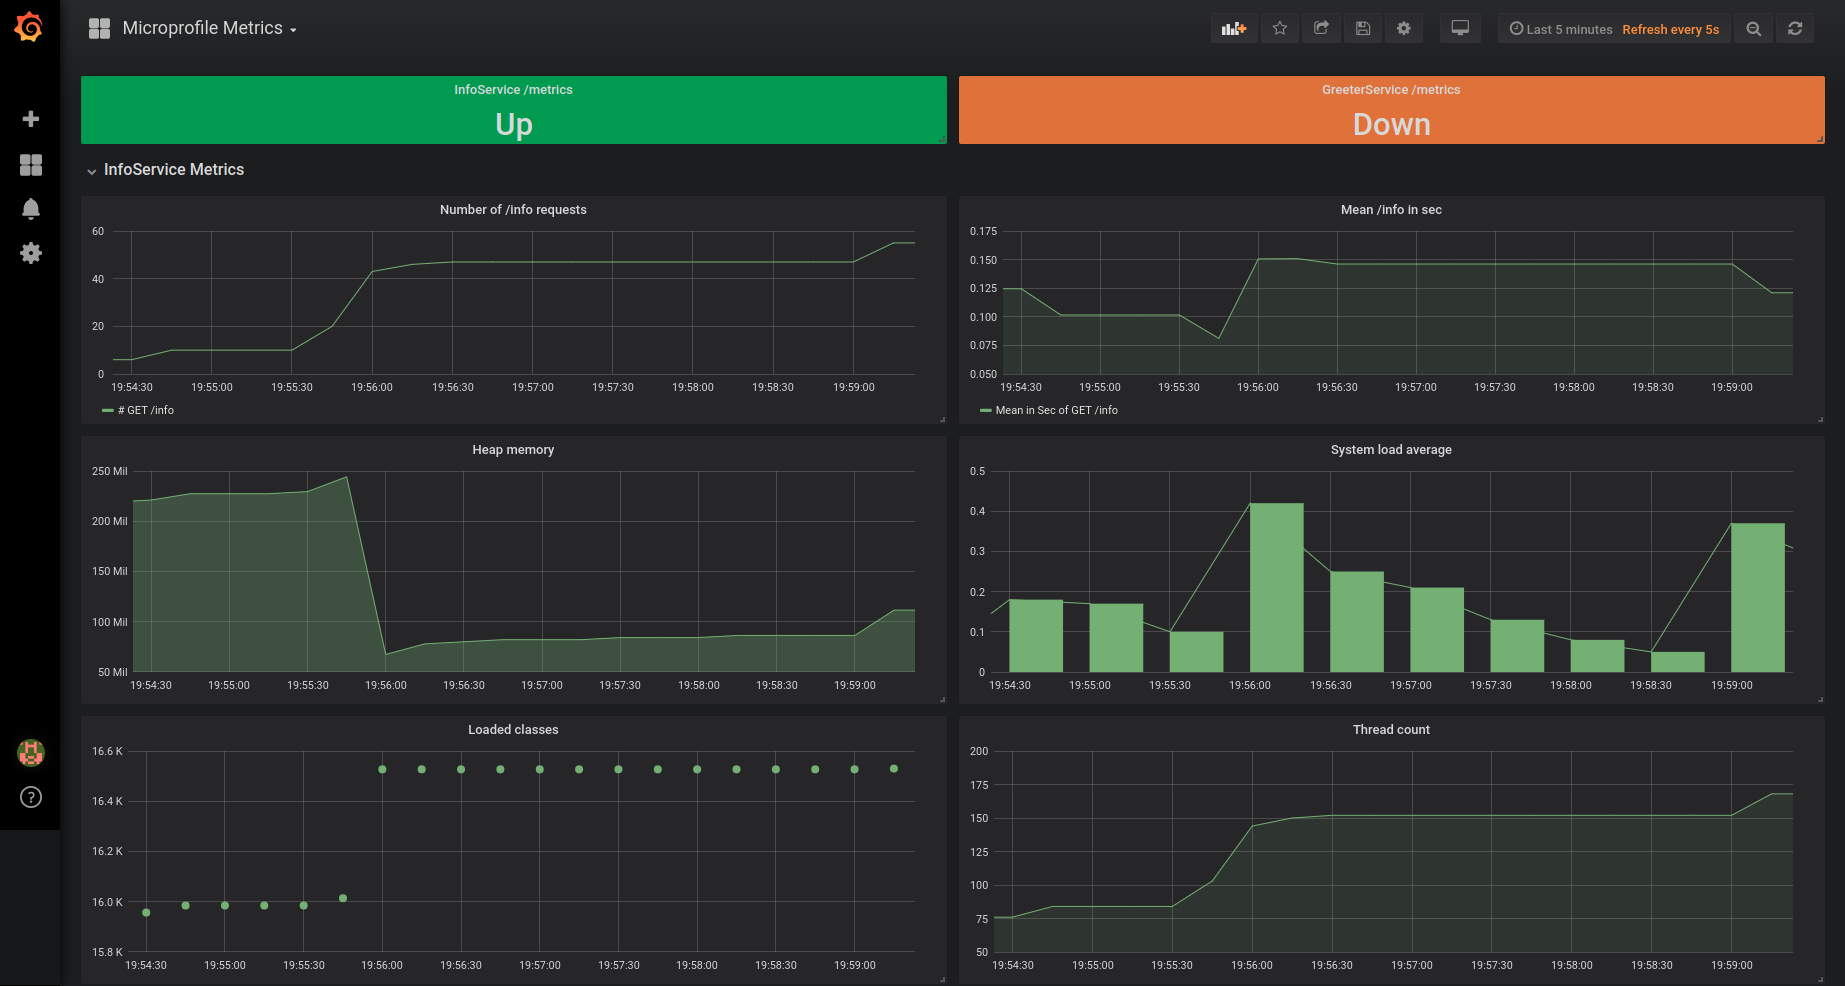
- Grafana: http://localhost:9091
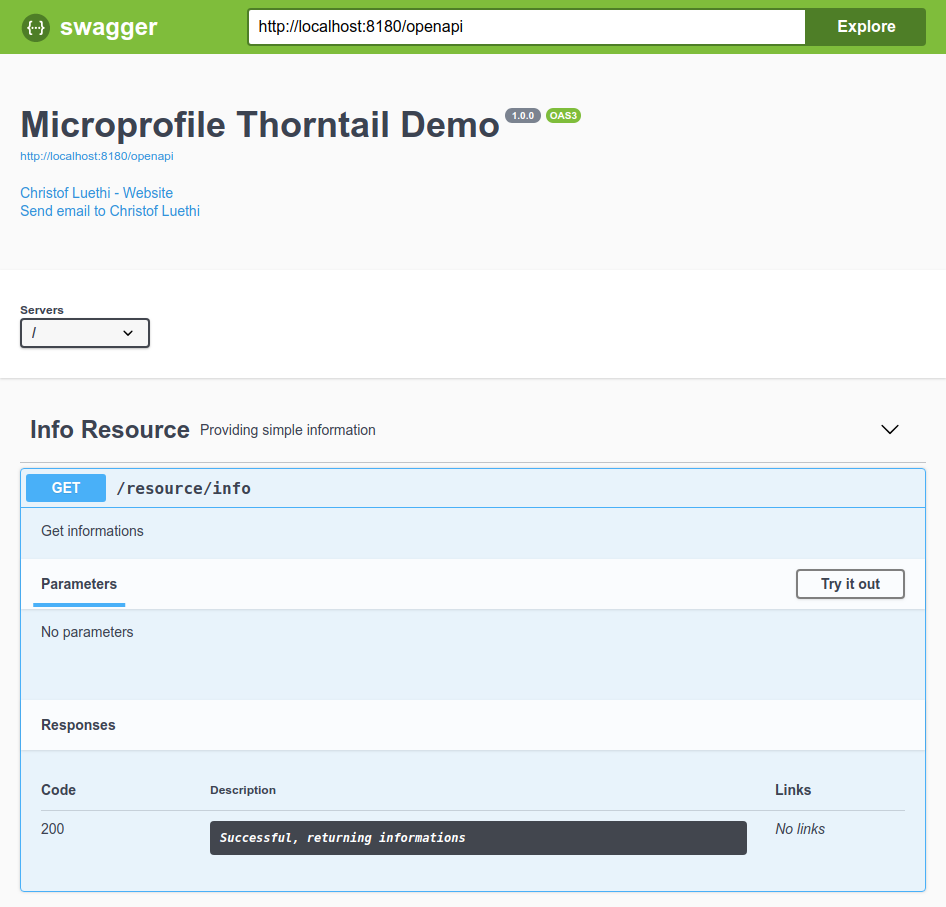
- SwaggerUI: http://localhost:9092
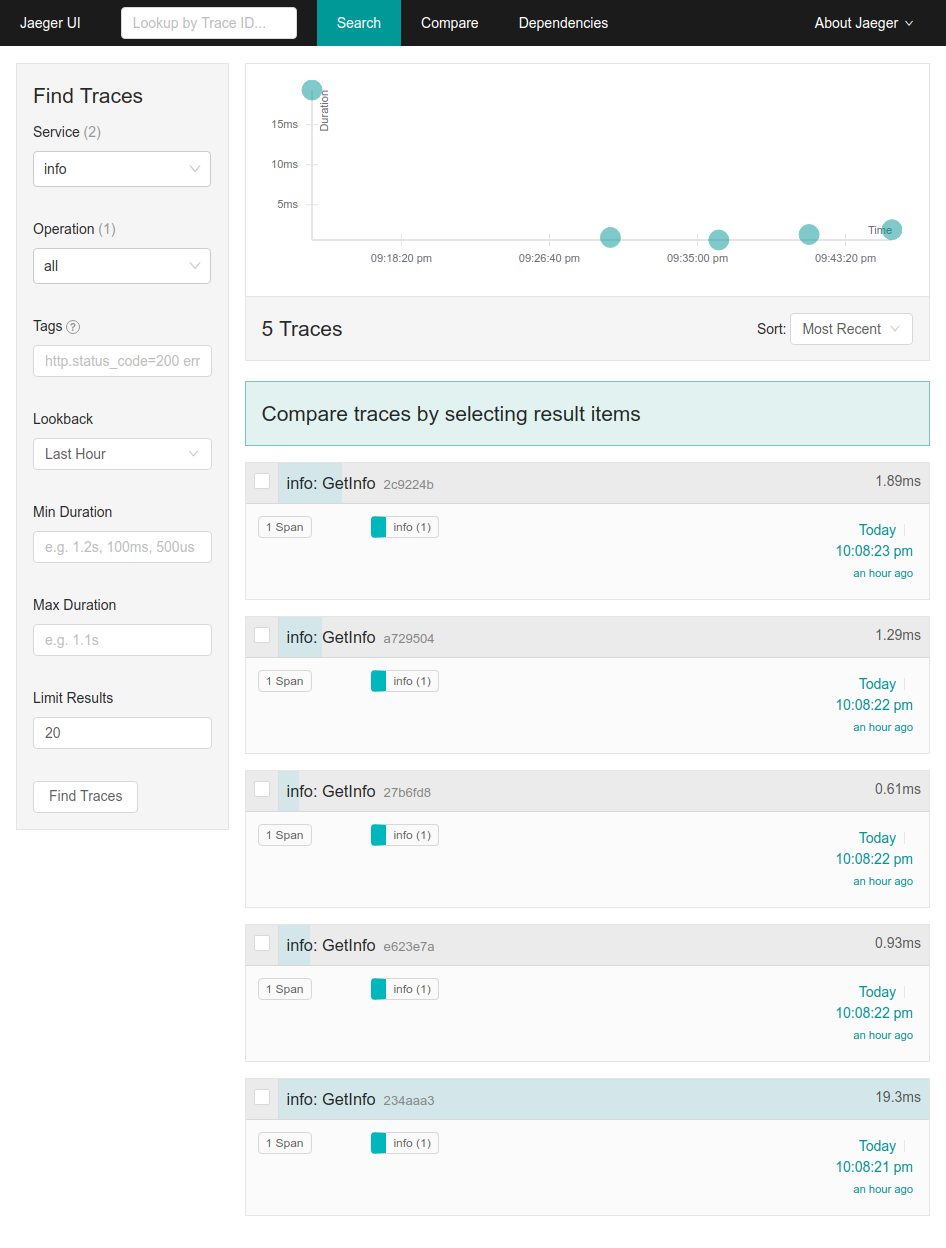
- Jagger: http://localhost:9093
- http://localhost:8180/resource/info
- http://localhost:8180/resource/greeting/reliable
- http://localhost:8180/resource/greeting/unreliable
Provide configurations based on multiple ConfigProviders. Resolution is made in the following order:
- Own custom providers
- System.getProperties()
- System.getEnv()
- META-INF/microprofile-config.properties
Default value may also be provided in code
    @Inject
    @ConfigProperty(name = "GREETER_BASE", defaultValue = "http://greeter:8080")
private String greeterBase;- http://localhost:8180/health
- http://localhost:8180/heap
- http://localhost:8180/threads
- http://localhost:8180/node
Username and Password for demo: health
Sample Result
{
   "outcome":"UP",
   "checks":[
      {
         "name":"diskSpace",
         "state":"UP",
         "data":{
            "freePercent":"65.73%",
            "total":"109.41 GB",
            "totalBytes":117477810176,
            "free":"71.92 GB",
            "freeBytes":77223878656
         }
      },
      {
         "name":"heapSpace",
         "state":"UP",
         "data":{
            "freePercent":"96.79%",
            "total":"776.00 MB",
            "max":"7.84 GB",
            "totalBytes":813694976,
            "maxBytes":8413773824,
            "free":"518.43 MB",
            "freeBytes":543612560
         }
      },
      {
         "name":"ping",
         "state":"UP"
      },
      {
         "name":"deadlockThread",
         "state":"UP"
      }
   ]
}- http://localhost:8180/metrics
- http://localhost:8180/metrics/base
- http://localhost:8180/metrics/vendor
- http://localhost:8180/metrics/application
Published at /metrics which is the expection of many tools. Export format is compatible with Prometheus.
Provide the following metric types
| Type | Description |
|---|---|
| Timed | A timer measures both the rate that a particular piece of code is called and the distribution of its duration. |
| Gauge | A gauge is an instantaneous measurement of a value. For example, we may want to measure the number of pending jobs in a queue |
| Counted | A counter is just a gauge for an AtomicLong instance. You can increment or decrement its value. |
| Metered | A meter measures the rate of events over time (e.g., "requests per second"). In addition to the mean rate, meters also track 1-, 5-, and 15-minute moving averages. |
| Metric | An annotation that describes the metric that is injected. |
Standard metrics can be found in the MicroProfile spec
Sample Result
# TYPE application:info_timed_rate_per_second gauge
application:info_timed_rate_per_second 2.9997439908192647E-12
# TYPE application:info_timed_one_min_rate_per_second gauge
application:info_timed_one_min_rate_per_second 3.4210458256715394E-14
# TYPE application:info_timed_five_min_rate_per_second gauge
application:info_timed_five_min_rate_per_second 2.310773322551314E-11
# TYPE application:info_timed_fifteen_min_rate_per_second gauge
application:info_timed_fifteen_min_rate_per_second 9.679151887649127E-11
# TYPE application:info_timed_min_seconds gauge
application:info_timed_min_seconds 0.072645071
# TYPE application:info_timed_max_seconds gauge
application:info_timed_max_seconds 0.428695293
# TYPE application:info_timed_mean_seconds gauge
application:info_timed_mean_seconds 0.07753049280863823
# TYPE application:info_timed_stddev_seconds gauge
application:info_timed_stddev_seconds 0.041419659260802266
# TYPE application:info_timed_seconds summary
application:info_timed_seconds_count 2.0
application:info_timed_seconds{quantile="0.5"} 0.072645071
application:info_timed_seconds{quantile="0.75"} 0.072645071
application:info_timed_seconds{quantile="0.95"} 0.072645071
application:info_timed_seconds{quantile="0.98"} 0.072645071
application:info_timed_seconds{quantile="0.99"} 0.428695293
application:info_timed_seconds{quantile="0.999"} 0.428695293
# TYPE application:info_requests counter
application:info_requests 2.0
Swagger-Like description of REST-Endpoints published as yaml. Endpoints may be hidden with @Operation(hidden = true)
Vendor-neutral APIs and instrumentation for distributed tracing.
Thorntail integrates with jaeger. However, additional jaegger dependency is needed (agent which pushes data).
OpenTracing does not (yet) work with the MP RestClient! Make sure you wrap your restclienta as follows.
@Traced
public String call() {
    Client client = ClientTracingRegistrar.configure(ClientBuilder.newBuilder()).build();
    try {
        String response = client.target("http://localhost:8080")
                .path("/simple")
                .request()
                .get(String.class);
        return "Called an external service successfully, it responded: " + response;
    } finally {
        client.close();
    }
}
See thorntails distributed tracing
It is increasingly important to build fault tolerant micro services. Fault tolerance is about leveraging different strategies to guide the execution and result of some logic. Retry policies, bulkheads, and circuit breakers are popular concepts in this area. They dictate whether and when executions should take place, and fallbacks offer an alternative result when an execution does not complete successfully.
| Type | Description |
|---|---|
| Timeout | Define a duration for timeout |
| Retry | Define a criteria on when to retry |
| Fallback | Provide an alternative solution for a failed execution |
| Bulkhead | Isolate failures in part of the system while the rest of the system can still function |
| CircuitBreaker | Offer a way of fail fast by automatically failing execution to prevent the system overloading and indefinite wait or timeout by the clients |
Sample Fallback with one retry if RuntimeException occures.
@Retry(maxRetries = 1, delay = 100, delayUnit = ChronoUnit.MILLIS, retryOn = RuntimeException.class)
@Fallback(GreetingFallbackHandler.class)
public Greeting getGreeting() {
    ...
}| Grafana | Jaeger | Swagger UI |
|---|---|---|
 |
 |
 |

