-
Notifications
You must be signed in to change notification settings - Fork 0
Home
cityxdev edited this page Sep 29, 2019
·
4 revisions

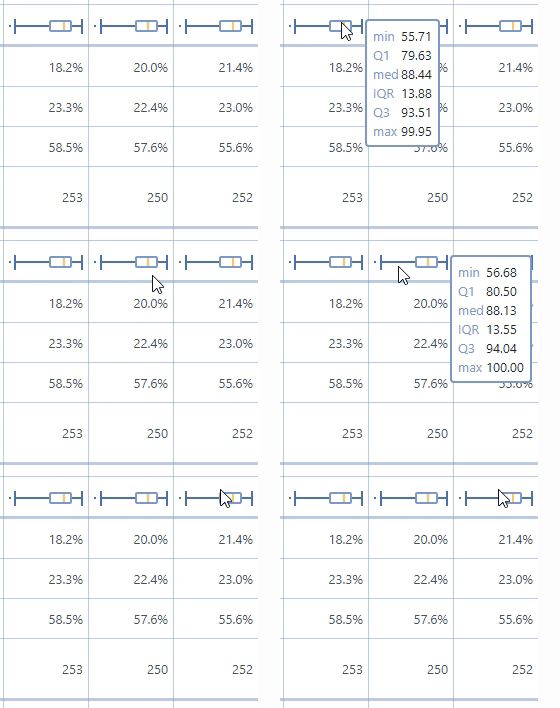
(in mobile devices, hovering falls back to tapping)
let bp = new org.cityxdev.boxplot.BoxPlot({
    values:{//mandatory
        data:[...],//optional
        min: ___MIN___,//optional if data is not defined. ignored otherwise
        p25: ___PERCENTILE_25___,//Q1 - mandatory if data is not defined. ignored otherwise
        p50: ___PERCENTILE_50___,//median - mandatory if data is not defined. ignored otherwise
        p75: ___PERCENTILE_75___,//Q3 - mandatory if data is not defined. ignored otherwise
        max: ___MAX___,//optional if data is not defined. ignored otherwise
        decimalPlaces:___DECIMAL_PLACES_FOR_LEGEND___//optional. default=2
    },
    $target:$('___SELECTOR___'),//mandatory jQuery element
    style:{ //optional
        height: '15px', //css
        width: '100%',  //css
        borderColor: '#4E74AB',//css
        borderWidthPx:2,

        medColor: '#FFC767',//css
        medWidthPx: 2,

        boxBorderColor: '#7E9AC4',//css
        boxWidthPx: 2,
        boxBackgroundColor: 'white',//css

        legendLabelColor:'#7E9AC4',//css
        legendValueColor:'#495057',//css
        legendBackgroundColor:'white',//css
        legendBorderColor:'#7E9AC4',//css
        legendBorderWidthPx:2
    },
    translation:{ //for legend - optional
        min:'min',
        q1:'Q1',
        med:'med',
        q3:'Q3',
        max:'max',
        iqr:'IIQ'
    }
});