Attaching to remote processes
The C# extension has supported local debugging for quite some time, and remote launch for a few months. With the 1.5 release it is now possible to attach as well. This wiki page will guide you through the steps to enable this. This guide is largely for SSH, but the mechanism is flexible, and other transports (Docker for example) can also be used.
In this section, we will walk through the steps for configuring SSH. If you are using Docker or some other transport, you can skip this.
There is no way to pop up credential UI with VS Code, so we need a scriptable way to authenticate. One option is to provide the password on the command line, but obviously there are some security concerns with passing an unencrypted password around so much. A more secure option is to use SSH keys. To do this, open a bash prompt and run the following commands (note: if you are on Windows you can find better instructions here). Since you want to store your key file without a password, make sure to keep it in a secure location.
mkdir ~/.ssh
chmod 700 ~/.ssh
ssh-keygen -t rsa
If you don't already have SSH installed on your server. The first step is obviously to install it. For example, on Ubuntu you can do that by running: sudo apt-get install openssh-server.
After SSH is installed, you want to add the public key generated in the last step (id_rsa.pub) to the list of keys in ~/.ssh/authorized_keys file on your server. If your computer has the ssh-copy-id command, the easy way is to run ssh-copy-id ExampleAccount@ExampleTargetComputer. Alternatively, you can copy the id_rsa.pub file to the server and then run cat id_rsa.pub >> ~/.ssh/authorized_keys.
Now that your client and server are configured, it is time to verify your connection works. To do this, open a terminal and type something like:
ssh ExampleAccount@ExampleTargetComputer echo "Hello World"
(Where ExampleAccount and ExampleTargetComputer should be replaced with appropriate values)
As the last server setup step, we need to download CLRDBG (the .NET Core command line debugger) onto the server. The easiest way to do this is by running the following command. Replace '~/clrdbg' with wherever you want CLRDBG installed to.
curl -sSL https://raw.githubusercontent.com/Microsoft/MIEngine/getclrdbg-release/scripts/GetClrDbg.sh |
    bash /dev/stdin latest ~/clrdbg
Now that we have our target machine ready to go, its time to configure your project. Open up .vscode/launch.json in VS Code, and add a new configuration to the end similar to the following:
        {
            "name": ".NET Core Remote Attach",
            "type": "coreclr",
            "request": "attach",
            "processId": "${command.pickRemoteProcess}",
            "pipeTransport": {
                "pipeProgram": "ssh",
                "pipeArgs": [ "ExampleAccount@ExampleTargetComputer" ],
                "debuggerPath": "~/clrdbg/clrdbg",
                "pipeCwd": "${workspaceRoot}"
            },
            "sourceFileMap": {
                "/home/ExampleAccount/ExampleProject": "${workspaceRoot}"
            }
        }
Here is what these options do:
-
processId: 'command.pickRemoteProcess' instructs Visual Studio code to bring up UI to select the process to attach to. You can also replace this with the process id of the process you would like to debug if for some reason you don't like the selection UI. -
pipeTransport.pipePorgram: This an the executable which should be launched to provide a connection to the target computer. In this example we are using SSH, so this is the path to ssh client command. -
pipeTransport.pipeArgs: This is any arguments to pass to the pipe program. For the SSH client library we need to provide the computer to connect to. To use SSH, replace ExampleAccount/ExampleTargetComputer with appropriate values. -
pipeTransport.debuggerPath: This is the path to where CLRDBG is running on the target computer. -
sourceFileMap: To debug programs built on computers other than the Visual Studio code computer, Visual Studio code needs to be hold how to map file paths. So, for example, if you are debugging 'ExampleProject' which was built in your home directory on the Linux server, and now you have the same code open in Visual Studio code, this rule tells the debugger to change any file paths that it sees in '/home/ExampleAccount/ExampleProject' and replace it with the open directory.
Once this is all setup, then switch to the debug tab in VS Code, open the configuration drop down and select your new configuration ('.NET Core Remote Attach'). You may need to restart VS Code to have your new configuration show up in the list.
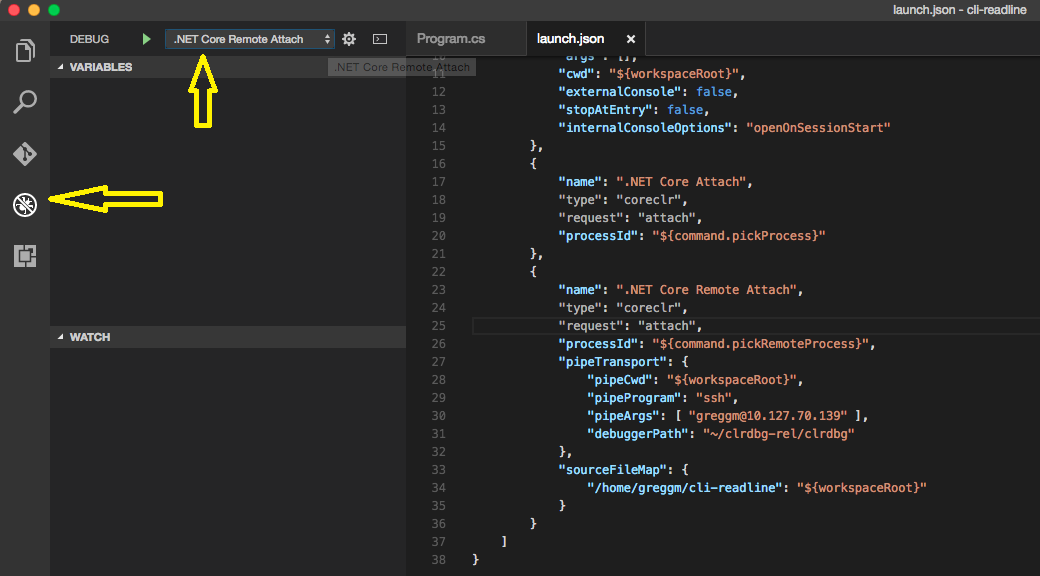
Once the configuration is selected. Press the play button (F5) to bring up the process selection UI and start debugging.
Last, to be able to debug obviously the application must somehow be runnable on the target box. For this you can either build the application on the target server, or build the application somewhere else and then deploy it (see .NET Core documentation for more information).
There are two special concerns in this area when it comes to debugging:
- Debug vs. Release Configuration: If you are going to be debugging, the experience is going to be much better if the debug configuration of your application is running instead of the release configuration. If this isn't possible, one can debug release code. To do this, disable justMyCode in launch.json.
- PDB files: In order for CLRDBG to be able to be able to map executable code back to its source code (or vice versa) CLRDBG needs to have PDB files. If you are already building your application on the target server, this is taken care of for you. If you are building it somewhere else, you need to make sure to copy the PDB files next to their associated dll or set the DebugType to 'embedded' so that the PDB data is kept inside of the compiled dll.