-
Notifications
You must be signed in to change notification settings - Fork 13
NewIn30
It is now possible for a user to configure marker sets to be visible in time graph views. The marker set defines a periodic marker with a specific period, reference and index range. The markers can further be split into equal length sub-markers or unequal length segments, recursively. The color, category, and label of each marker is configurable.
To configure a marker set, from the view menu select Marker Set > Edit..., and edit and save the XML file. To enable a marker set, select it from the same menu.

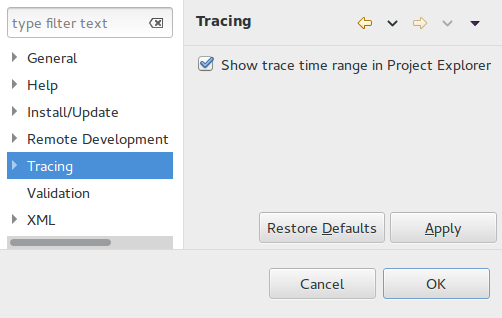
It is now possible to show the beginning and end time stamps for a trace in the project explorer. This is useful if you have many traces and know when an issue occurred. To activate this option, head to Preferences > Tracing and check the box Show trace time range in Project Explorer. The time is displayed in the Time Format from Tracing preferences.
If a trace is empty or its type unknown, nothing will be shown. It the range has not been fully read from the trace or the supplementary files, [...] will be shown. If the trace is being read and only its start time start is known, [start - ...] will be shown. Finally, when the end time end is also known, [start - end] will be shown.


It is now possible to enable/disable the trace types through the Trace Types Preference Page. The enabled trace types will be available under the Select Trace Type... menu and will be used to import traces while the disabled trace types will be ignored. To open the Trace Type Preference Page, select Preferences > Tracing > Trace Types.

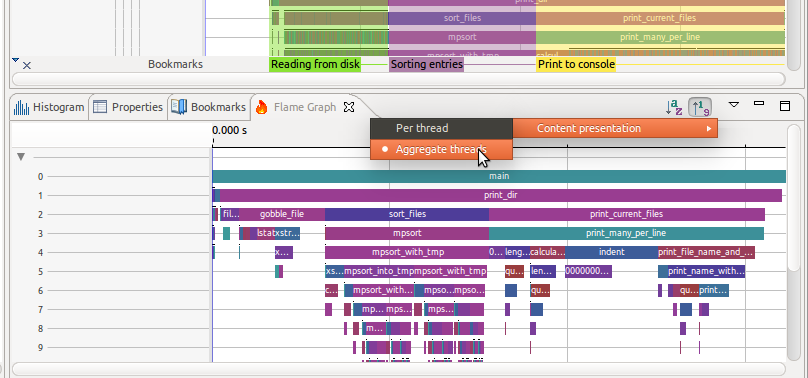
The flame graph now allows aggregation of individual threads or display of a flame graph per thread. To change the layout, click on the drop-down menu and select the Content Presentation.

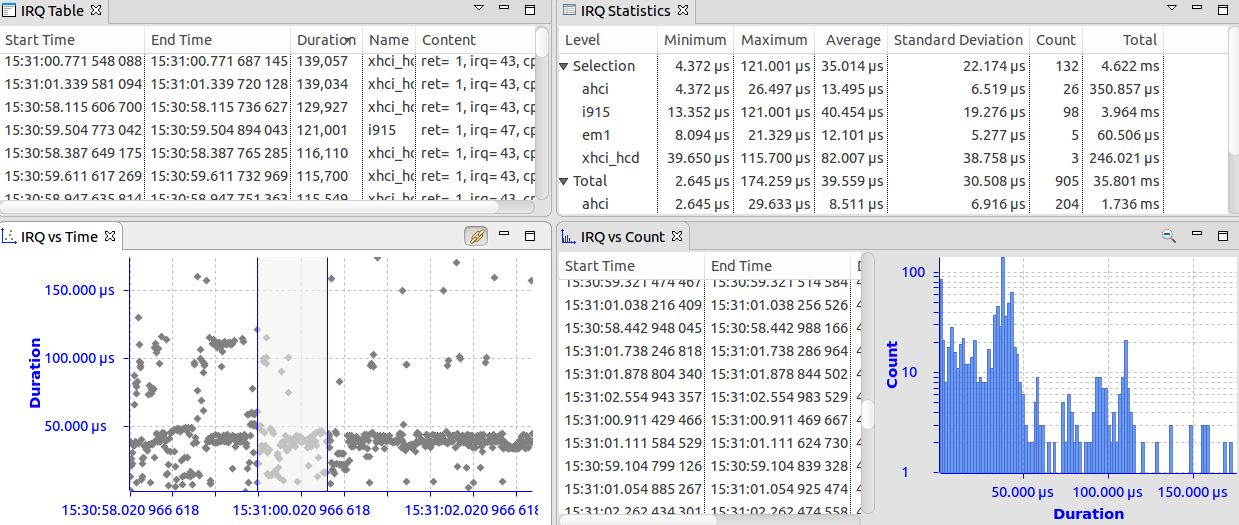
The Latency analysis for IRQ handlers measures the latency between the IRQ handlers entry and exit events. The durations are visualized using the Latency views. For more information about the Latency views see chapter Latency Analyses in the user guide.

Tracecompass now shows per-function statistics of any trace capable of filling a Call Stack view. This will work well with the flame graph, the call stack and the functions density view to give a whole view of the application performance execution.

The Control Flow View now supports line thickness to show if a given thread is executing or not.

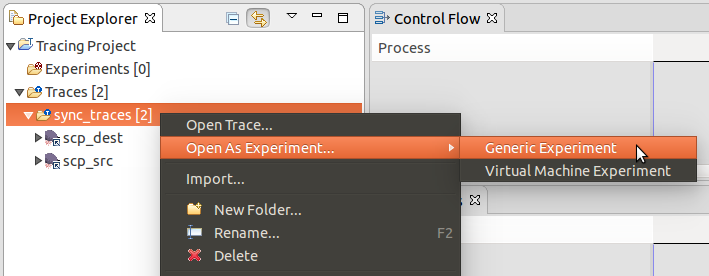
An experiment can now be quickly created and opened automatically by selecting one or more traces and/or trace folders in the Project Explorer view, and then selecting the Open As Experiment... context menu. A sub-menu with the available experiment types will be opened. After selecting the desired experiment type from the sub-menu, all selected traces and traces recursively found in selected trace folders will be added to the created experiment.

The Project Explorer has been enhanced to show all available analyses defined for traces under the "Views" node of the Experiment. If there are multiple traces of the same type the "Views" node will aggregate all available analysis that are the same to one entry in the tree. Each analysis output (view) can now be opened from the experiment context.

Until now, Segment Stores were backed by in memory data structures, limiting their size. Now, they can be also implemented in a similar way to the State History Tree, with an external memory tree data structure. This enables Segment Stores to store far more data and some efficient operations such as lazy iteration and lazy sorting. These new data structures are used by the System Call Analysis and the Scatter Graph Viewer.
The XML schema for data-driven analyses can now be extended, so that external and third-party plugins can add their own XSD elements and parsers to enhance the behavior of data-driven analyses.
See Bugzilla report Bugs Fixed in Trace Compass 3.0.0