-
Notifications
You must be signed in to change notification settings - Fork 8.3k
New issue
Have a question about this project? Sign up for a free GitHub account to open an issue and contact its maintainers and the community.
By clicking “Sign up for GitHub”, you agree to our terms of service and privacy statement. We’ll occasionally send you account related emails.
Already on GitHub? Sign in to your account
[APM] Correlations: Display latency distribution in a logarithmic scale #91574
Comments
|
Pinging @elastic/apm-ui (Team:apm) |
|
This ticket should also address other issues related to the inconsistent number of histogram buckets: |
|
Is the logarithmic scale supposed to be applied to the x or y axis? |
Only the x-axis (latency). Y-axis (occurrences) should still be linear. |
|
Here is a visualization I did with vega. The range query buckets were initially calculated with a Here is the vega for the overall distrib visualization: {
"$schema": "https://vega.github.io/schema/vega-lite/v4.json",
"title": "latency log log hist",
"data": {
"url": {
"%context%": true,
"%timefield%": "@timestamp",
"index": "_all",
"body": {
"aggs": {
"ranges": {
"range": {
"field": "transaction.duration.us",
"ranges": [
{"from": 9160, "to": 9206.68528083349},
{"from": 9206.68528083349, "to": 9253.6085000345},
{"from": 9253.6085000345, "to": 9300.770870290751},
{"from": 9300.770870290751, "to": 9348.173610470603},
{"from": 9348.173610470603, "to": 9395.817945654559},
{"from": 9395.817945654559, "to": 9443.705107166918},
{"from": 9443.705107166918, "to": 9491.83633260761},
{"from": 9491.83633260761, "to": 9540.21286588417},
{"from": 9540.21286588417, "to": 9588.835957243893},
{"from": 9588.835957243893, "to": 9637.706863306139},
{"from": 9637.706863306139, "to": 9686.826847094817},
{"from": 9686.826847094817, "to": 9736.197178071017},
{"from": 9736.197178071017, "to": 9785.819132165829},
{"from": 9785.819132165829, "to": 9835.693991813305},
{"from": 9835.693991813305, "to": 9885.823045983616},
{"from": 9885.823045983616, "to": 9936.207590216358},
{"from": 9936.207590216358, "to": 9986.848926654031},
{"from": 9986.848926654031, "to": 10037.74836407571},
{"from": 10037.74836407571, "to": 10088.907217930813},
{"from": 10088.907217930813, "to": 10140.326810373183},
{"from": 10140.326810373183, "to": 10192.008470295194},
{"from": 10192.008470295194, "to": 10243.953533362119},
{"from": 10243.953533362119, "to": 10296.163342046639},
{"from": 10296.163342046639, "to": 10348.639245663551},
{"from": 10348.639245663551, "to": 10401.382600404628},
{"from": 10401.382600404628, "to": 10454.394769373672},
{"from": 10454.394769373672, "to": 10507.677122621746},
{"from": 10507.677122621746, "to": 10561.231037182579},
{"from": 10561.231037182579, "to": 10615.057897108149},
{"from": 10615.057897108149, "to": 10669.159093504462},
{"from": 10669.159093504462, "to": 10723.536024567498},
{"from": 10723.536024567498, "to": 10778.190095619351},
{"from": 10778.190095619351, "to": 10833.122719144538},
{"from": 10833.122719144538, "to": 10888.335314826514},
{"from": 10888.335314826514, "to": 10943.82930958436},
{"from": 10943.82930958436, "to": 10999.606137609655},
{"from": 10999.606137609655, "to": 11055.667240403549},
{"from": 11055.667240403549, "to": 11112.014066814012},
{"from": 11112.014066814012, "to": 11168.648073073278},
{"from": 11168.648073073278, "to": 11225.570722835486},
{"from": 11225.570722835486, "to": 11282.7834872145},
{"from": 11282.7834872145, "to": 11340.287844821929},
{"from": 11340.287844821929, "to": 11398.085281805346},
{"from": 11398.085281805346, "to": 11456.177291886692},
{"from": 11456.177291886692, "to": 11514.56537640088},
{"from": 11514.56537640088, "to": 11573.251044334596},
{"from": 11573.251044334596, "to": 11632.235812365298},
{"from": 11632.235812365298, "to": 11691.52120490041},
{"from": 11691.52120490041, "to": 11751.108754116727},
{"from": 11751.108754116727}
]
}
}
},
"size": 0
}
},
"format": {"property": "aggregations.ranges.buckets"}
},
"transform": [
{"calculate": "log(datum.doc_count)/log(10)", "as": "log_y"}
]
"mark": "bar",
"encoding": {
"x": {"field": "key", "type": "nominal", "axis": {"title": false}, "sort": {"ord": null}},
"y": {
"field": "log_y",
"type": "quantitative",
"axis": {"title": "latency"}
}
}
}For individual term fields, I simply added a filter query and kept the same ranges. Note the Note how Service 2.0 correlates highly (> 0.2) and has a very similar graph. Service 1.0 correlates highly in the other way (< -0.2), it has many missing buckets on the edges. It's effectively just that first "bump" (I couldn't get vega to allow many |
|
https://github.com/elastic/ml-aiops-poc/blob/master/aiops/log_log_hist.py implementates an algorithm that is effective at creating the parameters and values for log log histograms from ES data. Results are shown here: https://github.com/elastic/ml-aiops-poc/blob/master/notebooks/explore_eden_log_log_hist.ipynb. In addition the visuals produced by pandas by the mechanism look good and can provide a reference for visuals in this space. |
|
This is being implemented by the ML team. |

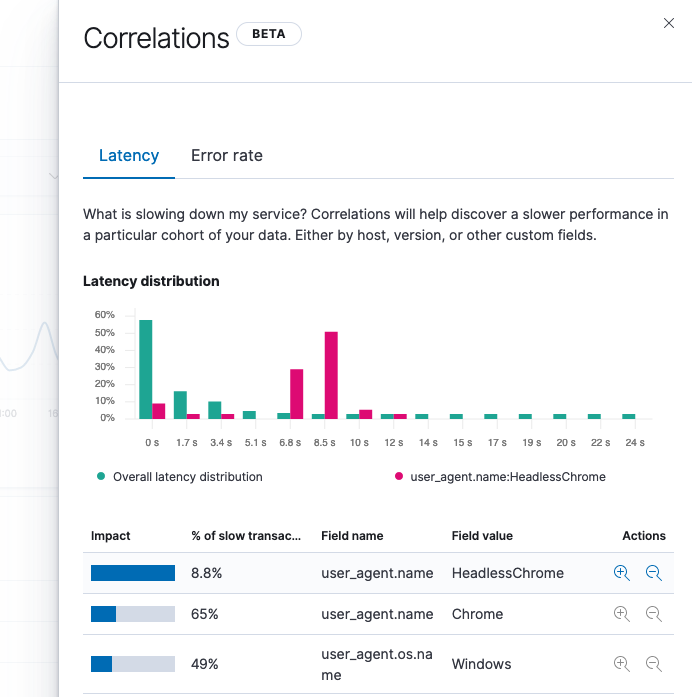
Currently the latency distribution chart in correlations show the data in a linear scale with 15 buckets:

We should instead render a chart with a logarithmic scale so that small amount in extreme cases will still be visible to the user.
The text was updated successfully, but these errors were encountered: