

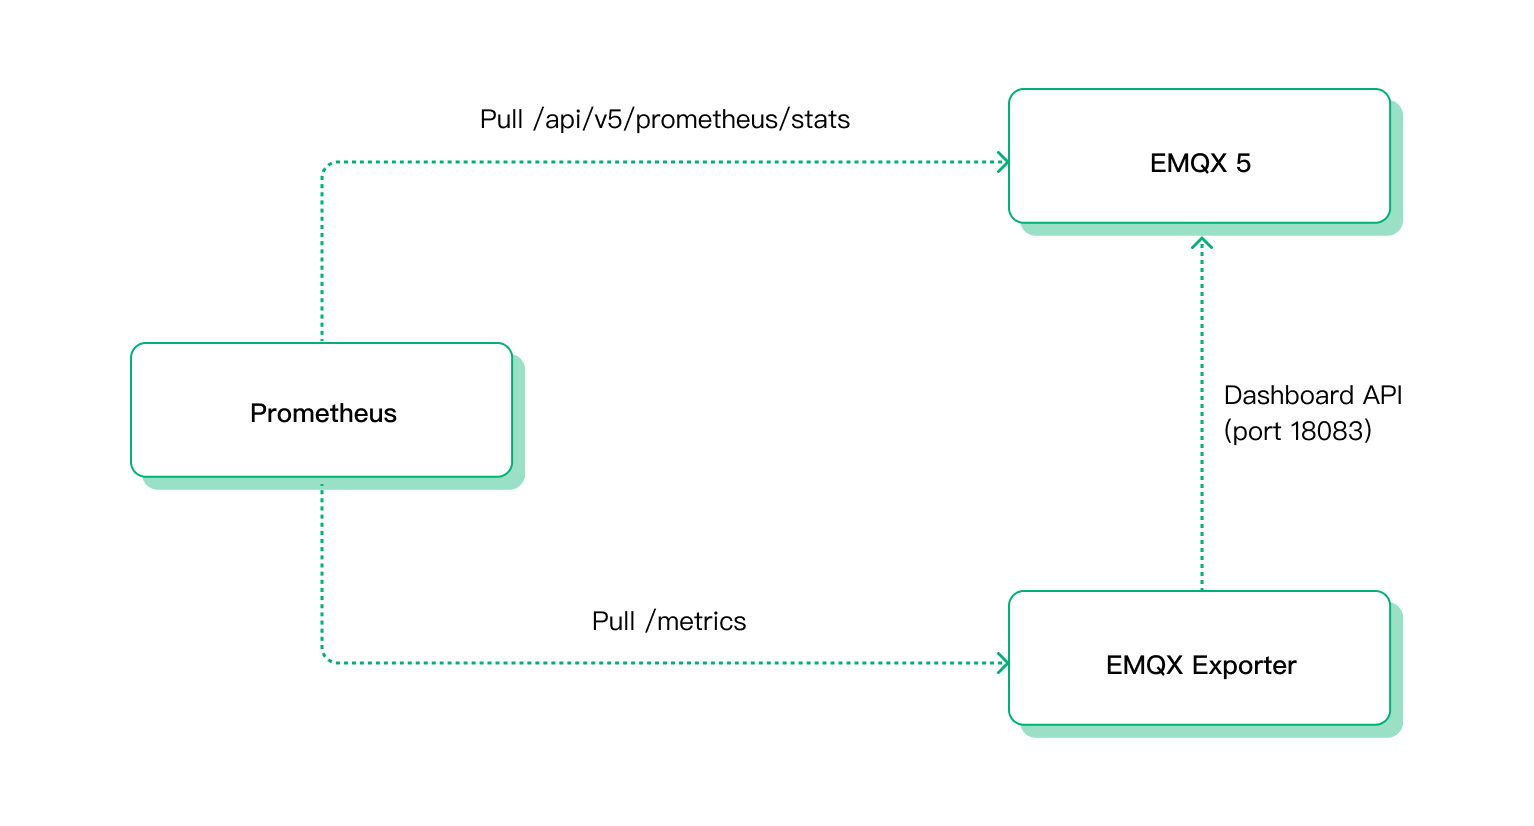
The `emqx-exporter` is designed to expose partial metrics that are not included in the EMQX Prometheus API.
It is compatible with EMQX 4.4 and EMQX 5, both open-source and enterprise.
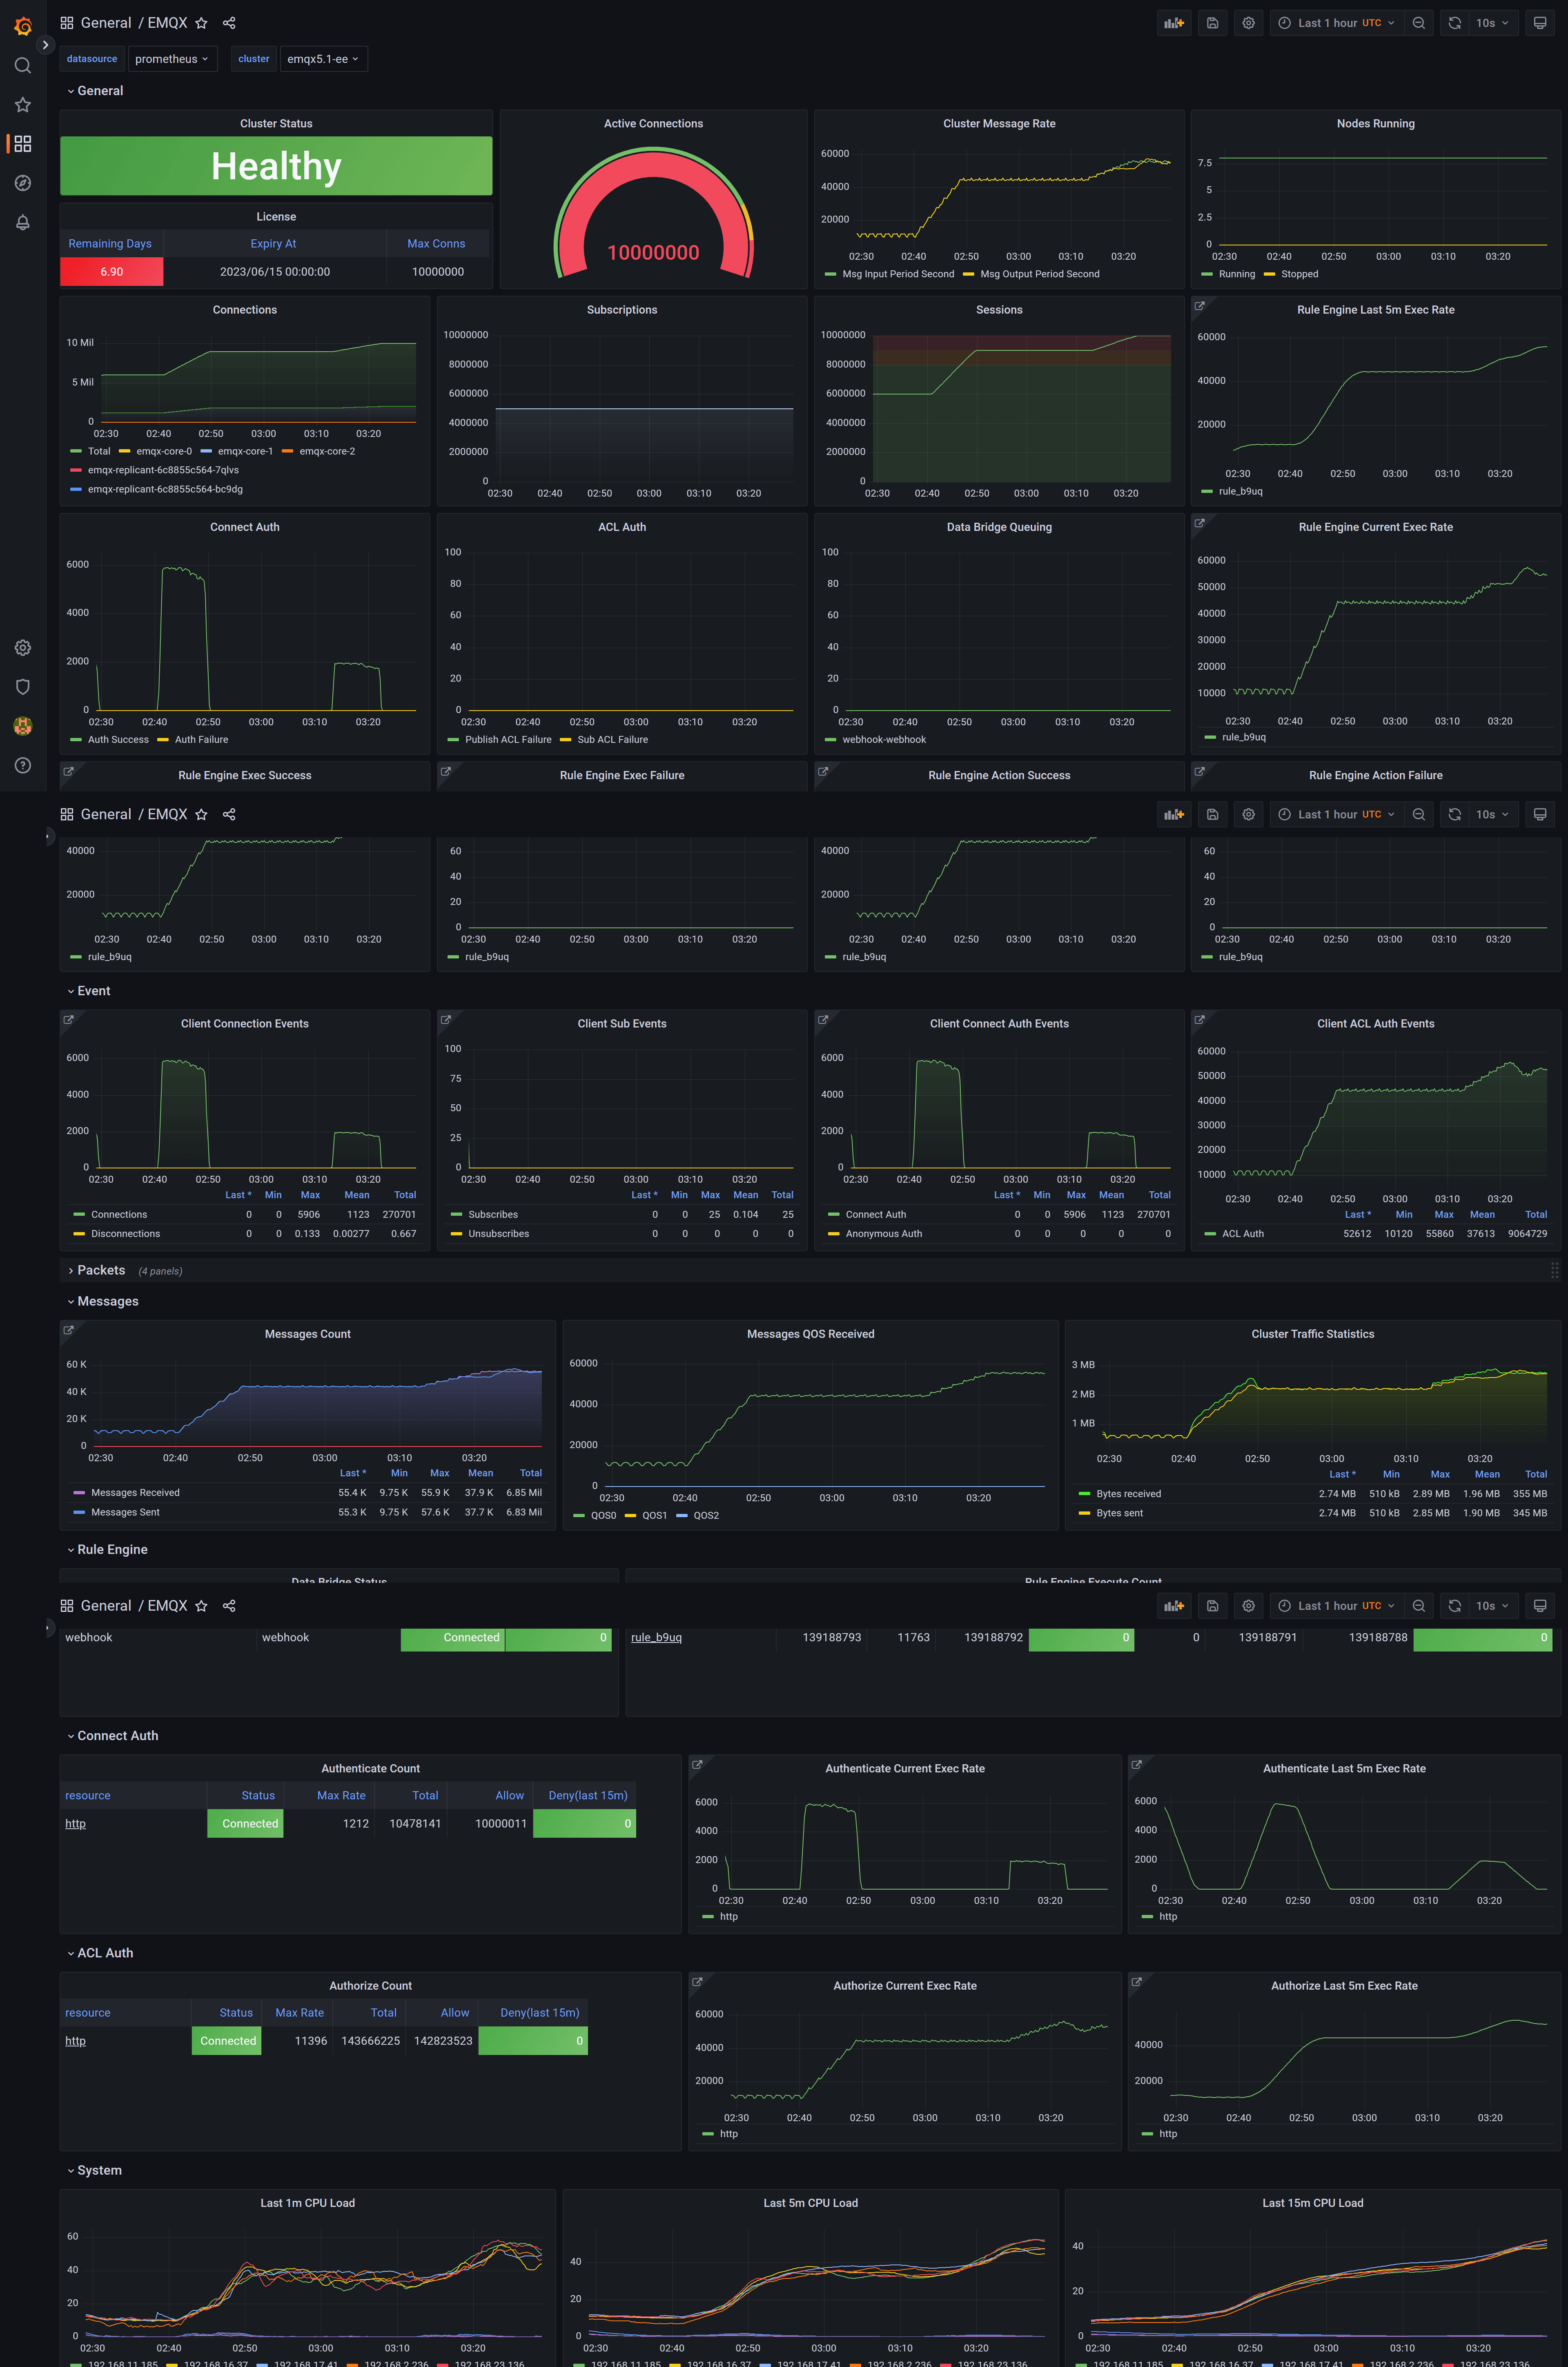
See the documentation Instruction for an explanation of the metrics on the dashboard
The emqx-exporter listens on HTTP port 8085 by default. See the --help output for more options.
EMQX exporter requires access to the EMQX dashboard API with basic auth, so you need to sign in to the dashboard to create an API secret Note that it is different to create a secret between EMQX 5 and EMQX 4.4 on the dashboard.
-
EMQX 5
- Create a new API KEY.
-
EMQX 4.4
- Create a new
Userinstead ofApplication
- Make sure the
emqx_prometheusplugin has been started on all nodes, check it one by one on the dashboard http://your_cluster_addr:18083/#/plugins.
- Create a new
make build
./bin/emqx-exporter <flags>
Refer to the example to deploy a complete demo by docker compose.
Refer to the example to learn how to deploy emqx-exporter on the Kubernetes.
Sample config file like this
metrics:
  target: 127.0.0.1:18083
  api_key: "some_api_key"
  api_secret: "some_api_secret"
probes:
  - target: 127.0.0.1:1883
The metrics and the probes are not required configuration items, if not set metrics, the metrics feature will disable, and if not set probes, the probe feature will disable.
The scrape config below is available for EMQX 5
scrape_configs:
- job_name: 'emqx-self-metrics'
  metrics_path: /api/v5/prometheus/stats
  scrape_interval: 5s
  honor_labels: true
  static_configs:
    # a list of addresses of all EMQX nodes
    - targets: [${your_emqx_addr}:18083]
      labels:
        # label the cluster name of where the metrics data from
        cluster: ${your_emqx_addr}
        # fix value, don't modify
        from: emqx
- job_name: 'exporter-metrics'
  metrics_path: /metrics
  scrape_interval: 5s
  static_configs:
    - targets: [${your_exporter_addr}:8085]
      labels:
        # label the cluster name of where the metrics data from
        cluster: ${your_cluster_name}
        # fix value, don't modify
        from: exporter
- job_name: 'exporter-probe'
  metrics_path: /probe
  params:
    target:
      # must equal the `probes[$index].taget` in config file
      - "127.0.0.1:1883"
  scrape_interval: 5s
  static_configs:
    - targets: [${your_exporter_addr}:8085]
      labels:
        # label the cluster name of where the metrics data from
        cluster: ${your_cluster_name}
        # fix value, don't modify
from: exporterImport all templates to your Grafana, then browse the dashboard EMQX and enjoy yourself!
The templates of dashboard ares JSON files, about how to upload a dashboard JSON file, you can check out here.
EXPERIMENTAL
The exporter supports TLS via a new web configuration file.
./emqx-exporter --web.config.file=web-config.ymlSee the exporter-toolkit https package for more details.